Frequently Asked Questions (FAQ) - Operational
The most common FAQs of an operational nature that have been received from users in relation to the TENGRAPH Web system are listed in this section.
These FAQs include:
Answer:
There is a scanned legend in PDF available for every geological map sheet.
The Geology mosaic comprise several separate maps stitched together using different abbreviations and geology descriptions.
You will need to identify the map sheet name and down load the legend specifically for the map displayed.
The following 9 steps will help you find the correct geology map legend to download.
Procedure:
Step 1:
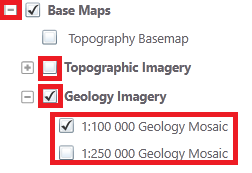
In TENGRAPH Web ensure the Mapsheet index referring to your scale of geology (1:100,000 or 1:250,000) and the 1:1,000,000 index display is turned on. The layers will need to be expanded as shown below.

Step 2:
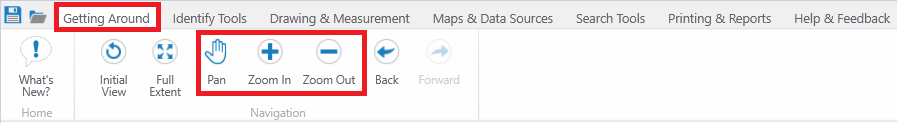
Zoom to the area you are interested in using one of the Search Tools or the Navigation tools in the "Getting Around" Tab.
Step 3:
Choose the geology layer you want and deselect any other Base layers or map layers not required.
Step 4:
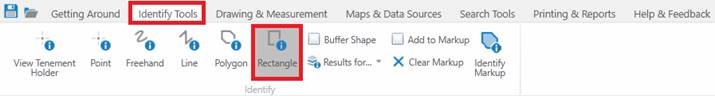
Open the "Identify Tools" Tab and choose the "Retangle", click and drag over the area of interest.
Step 5:
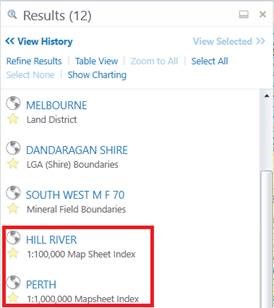
Use the information in the Results to find what map sheet/ sheets you will need to download. In this example the "Perth 1:1,00,00" and "Hill River 1:100,00" mapsheets have been identified.
Step 6:
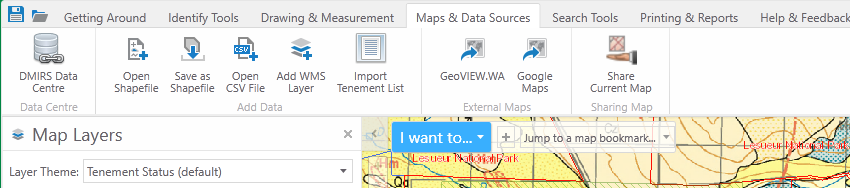
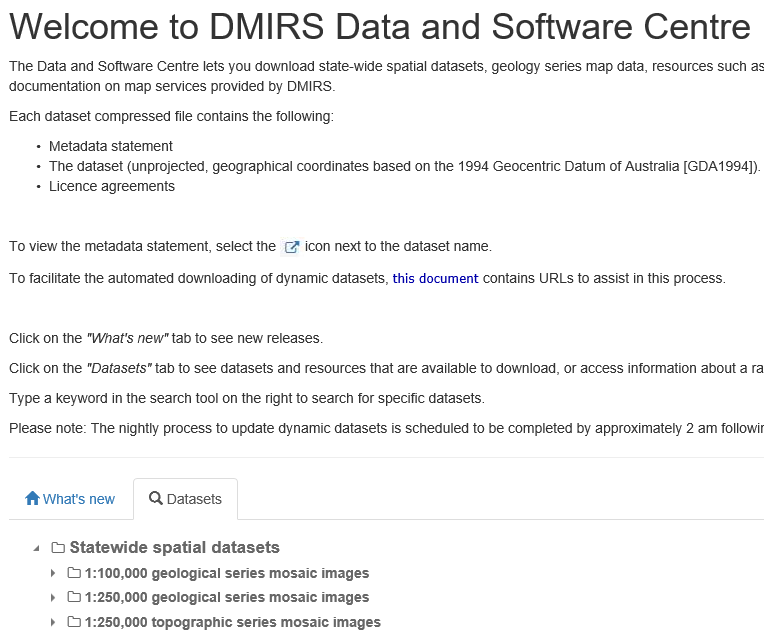
Now that we know what map sheets are affected navigate to the DMIRS data and software centre. Tengraph Web has a shortcut in the "Maps and Data Sources" Tab
Step 7:
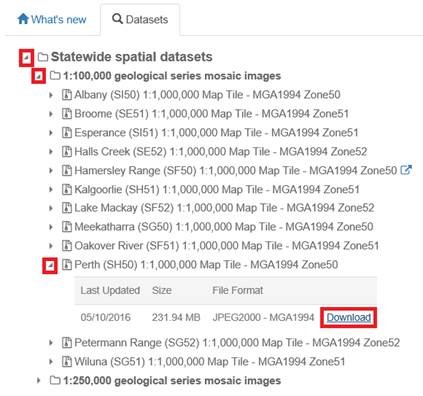
Open the Statewide spatial datasets folder and the 1:100,000 folder and find the file containing the 1:1,000,000 map sheet, in this example it is "Perth".
If you are viewing the 1:250,000 geological mosaic in TENGRAPH use the alternative folder.
Step 8:
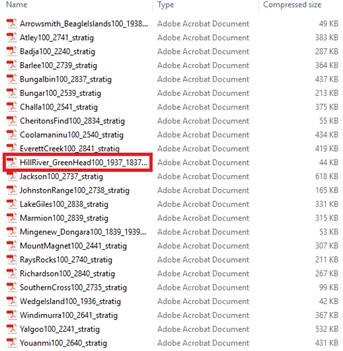
When the Perth 1:1,000,000 has finished downloading open the "legends"folder and select the PDF pertaining to your map identified in the results from step 5,
In this case it is "Hill River."
Step 9:
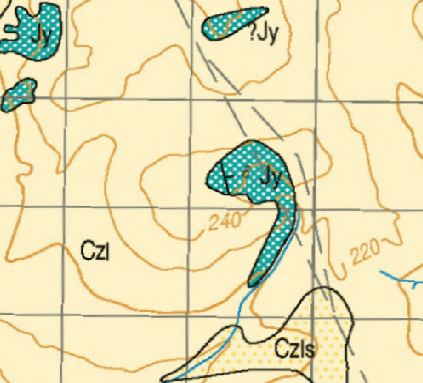
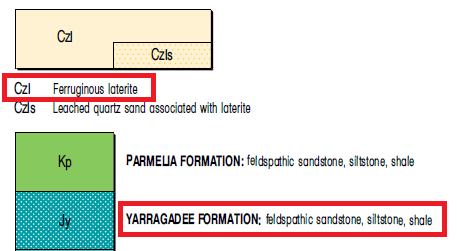
Compare the downloaded PDF legend with the original TENGRAPH Web display.
On the Hill River 1:100,000 map sheet Czl represents Ferruginous laterite.
|
TENGRAPH Geology Map Display |
Downloaded Hill River Map Legend from Data Centre |
|
|
|
Answer:
- Click on the
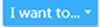 icon to open the menu.
 - Select Find a mining tenement from the menu
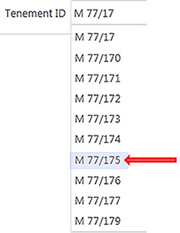
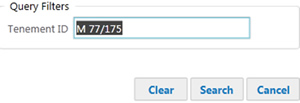
- Enter a tenement id. in the search panel provided.
Note: A space between the tenement type and the district number is required for the search to work. e.g. M 77/175
- From the list presented select a mining tenement.
- Click on the search button
- The system will list the tenement Id in the Results panel and display its boundaries on the map.
Answer:
- Identify a mining tenement using one of the Tenement Search or
 i button Identify Tools. The results will appear in the Information Panel.
 - In the Results List select the mining tenement Id with your mouse.
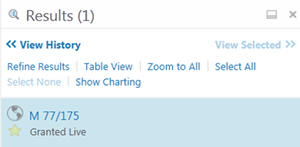
- A new window will open displaying information about it.
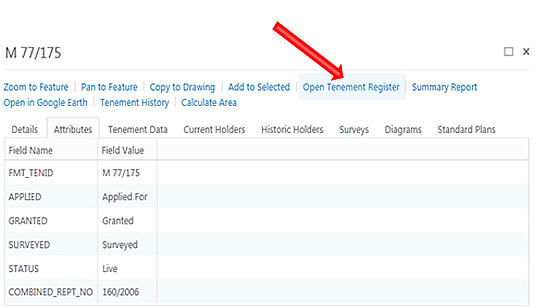
- Click on the relevant tabs to find tenement information
- For detailed tenement information open Mineral Titles Online by clicking on Open Tenement Register.
Answer
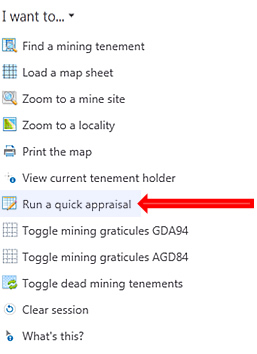
The easiest way to find out what land overlays a tenement area is to run a Quick Appraisal Report accessed via the ![]() or Feature Action menus.
or Feature Action menus.
Answer
In the Results panel, click ![]() . This will remove the yellow highlight and results from the selection.
. This will remove the yellow highlight and results from the selection.
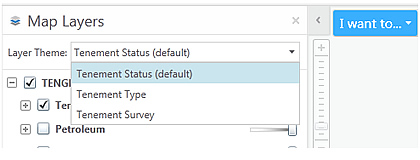
The quickest way to view surveyed tenements is to select the Tenement Survey theme.
Open the Layer Theme drop-down menu and click on Tenement Survey as shown below.
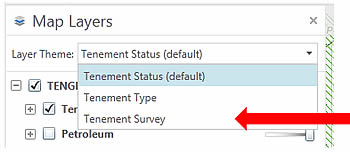
This will display all the surveyed tenements on your map represented by a solid line.
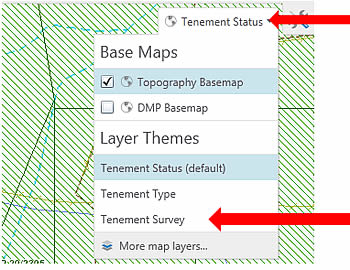
The same display can be achieved by selecting the Tenement Survey option from the Base Map drop-down menu.
For more information refer to the Map Layer Themes and Groups in the TENGRAPH Web user manual.
To colour mining tenements by their type (colour Exploration, Prospecting and mining leases differently) select the Tenement Type theme.
Answer:
The default TENGRAPH theme portrays tenements as either live (in a green colour) or pending (in a blue colour). Selecting a different Layer Theme will colour tenements by their type or survey status.
Answer:
Using the TENGRAPH navigation or search tools locate a live Exploration Licence.
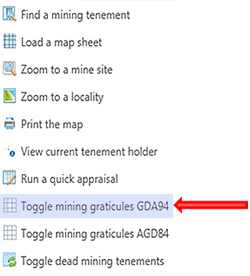
Open the ![]() menu and Toggle on the GDA94 mining graticules.
menu and Toggle on the GDA94 mining graticules.
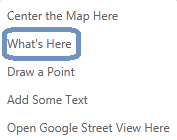
Move your mouse over a graticule block on the map you would like to identify and right click to open the Context menu shown below.
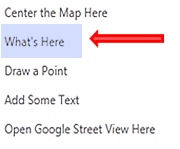
Click on the What's Here menu option.
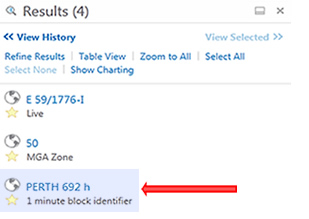
A description of the graticule block affected is displayed in the Results as shown below.
Or, if you prefer to have a printed description use the "Create graticule polygon and description" tool.
- Click on the Drawing and Measurement Tab.
- Click on the Enhanced Plotting Tools icon to open the drop down menu.
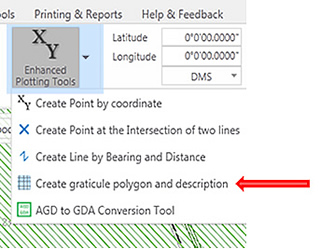
- From the drop down menu click on the "Create graticule polygon and description." This will open the Graticular Selection Tool.
- Use your mouse to click on a block(s) displayed on the map. The block selected will be coloured on the map.
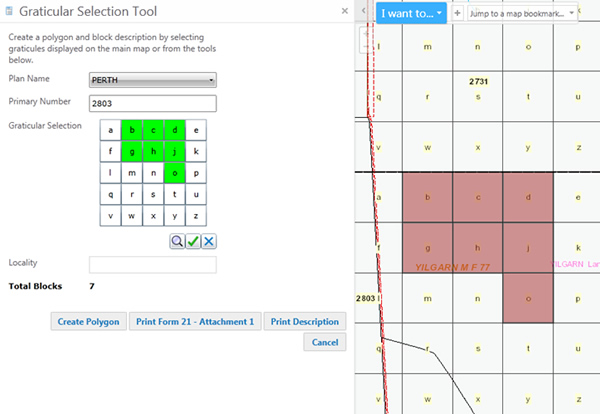
- Click on the Print Description button.
- Click on the Download link to open the block(s) details.
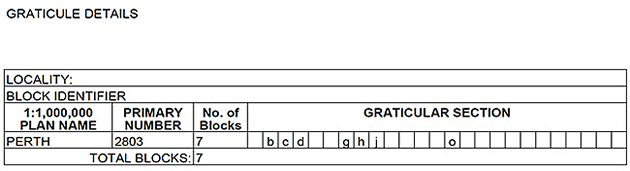
Example of a downloaded block description
- Mining Tenement Boundary Coordinates
Answer:
Open the Print Object Details Report.
- Open the Context Menu (Right mouse click over a mining tenement on the map display).
- From the options presented click on "What's Here".
- Any features displayed on the map display are listed in the Results.
- Within the Results panel right click on a mining tenement Id: (or another feature displayed on the list). The Feature Action menu will open as shown below.
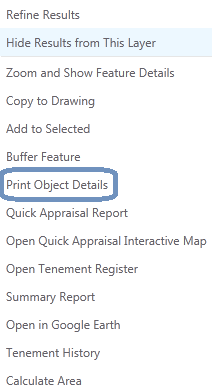
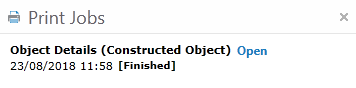
- Select Print Object Details from the menu.
- Open the tenement coordinate details when finished.
- Polygon Drawing or Shapefile coordinates:
Answer"
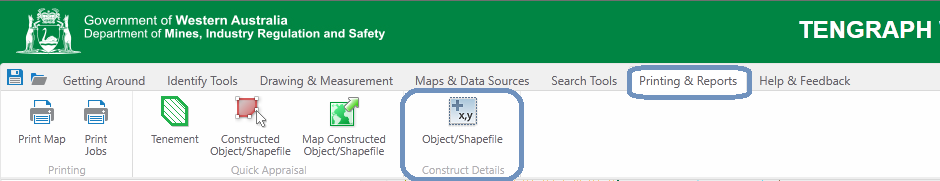
Use the Print Object Construction Details Report.
- Open the "Printing and Reports" Tab
- Click on the Construction/Shape file icon as shown.
Answer:
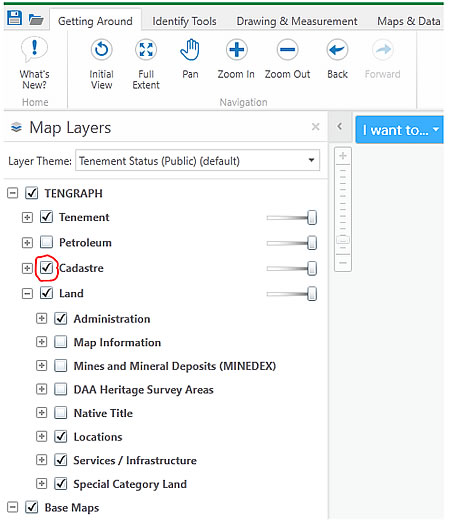
Beside each layer or folder name in the Map Layers List, there is a check box that is used to turn the layer on or off.
Click the check box to turn layer display ON ![]()
OR
Unclick the check box to turn display OFF ![]()
Answer:
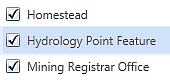
- Within the Map Layers panel open the Services/Infrastructure Folder.
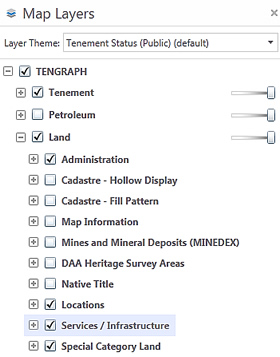
- Turn the Hydrology Point Feature Map Layer on by clicking on the check box.
- Dams/Bores/Tanks etc. will be visible on the map between a scale of 1:1 to 1:230,000
OR select a topographical Base Map
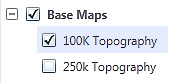
- Open the Base Maps Folder
- Select either the 1:100,000 or 1:250,000 Topography base map.
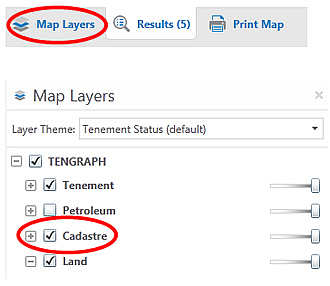
Ticking the Cadastre folder check box located in the Map Layer List will display reserves, private property and other cadastre on your map.
NOTE: The Cadastre is not shown at all map scales. You may have to zoom in until the layer become visible. Reserves and National Parks are displayed on the map with a red fill pattern.
When you have located the cadastre on the map, use the right mouse button and click on it. A new menu will open, select the "What's Here" tool.
- Cadastre displayed on the map at the mouse position will appear in the results.
- Clicking on the id shown in the results will open more information
- To find a Reserve number or Freehold title click on the Search Tab and open the Advanced Land drop down menu.
- Click on the Search Tools Tab and open the Advanced Land drop-down menu as shown below.
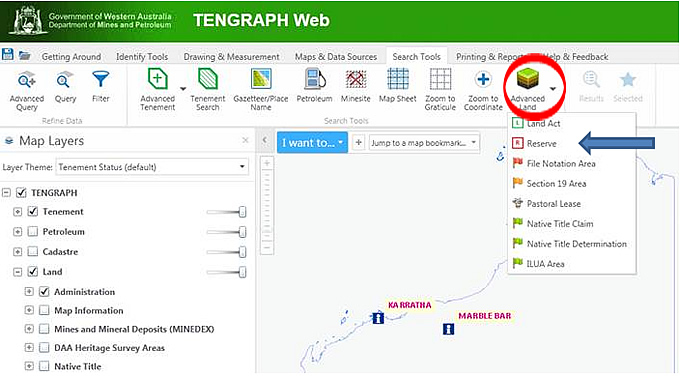
Note: Use the Advanced Land menu to search for freehold land under the Land Act, pastoral leases, File Notation Areas, Section 19 and native title boundaries.
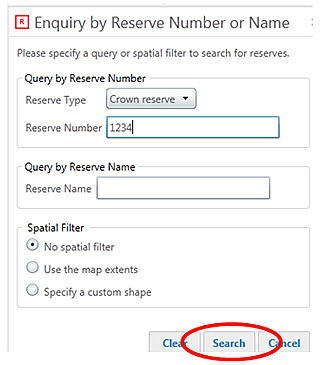
- Click on
 Reserve and type in the reserve id number in the new window, click Search.
- From the Results click on the Reserve number and then Zoom to Feature.
The reserve boundary is highlighted yellow on the map.

Note: You don’t need the Cadastre layer display turned on for this search tool to work.
Toggle to the Map Layers and click the Cadastre layers on if you require the surrounding cadastre displayed on the map.
Tip : Use the toolbar located at the bottom of the Information panel to toggle between the Results, Map Layers and any open tools or reports.
Answer:
The Copy to Drawing tool is used to change the colour of a feature displayed on the map.
- Open the tenement information window
- Select Copy to Drawing.
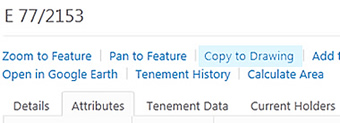
- A blue polygon identical to the mining tenement is created.
- On the main toolbar Click on the Drawing & Measurement Tab, the Edit tool and then the blue polygon if you wish to change the colour, transparency or thickness.
Answer:
Coordinates obtained from TENGRAPH are intended as a guide only and may not reflect the accuracy of the ground position.
Coordinates associated with surveyed boundaries are subject to minor adjustment due to improved survey and data maintenance procedures.
Answer:
- Click on the Drawing & Measurement
 Edit Tool
 - Left mouse click over the text you want to move.
- While still holding the mouse button down move the mouse pointer to a new position.
- The text will move with the mouse position.
- When you are satisfied with the new location release the mouse button.
Answer:
TENGRAPH Web may allow you to turn the labels on and off in some layers.
- On the Tool bar click Map Layers.
- Right click on a Map layer to open the Layer Action Menu.
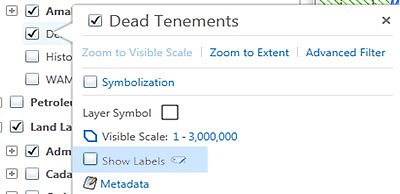
- To turn the labels off clear the Labels check box.
Answer:
- Within the Map Layers panel open the Tenement Layers folder
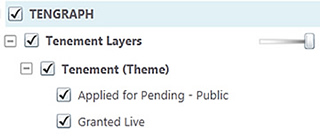
- Right mouse click on the Applied for Pending layer, a new menu will open.
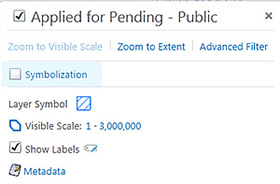
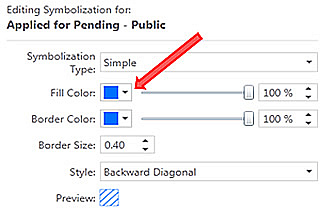
- Click on the Symbolization link
- Click on the Fill Color: icon to open the color palette.
- Select the "No Color" option
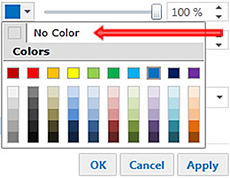
- Click on Apply, the map is redrawn displaying pending tenements without the blue pattern.
- Click OK.
- Repeat the same steps for the Granted Live tenement layer.
Using the Symbolization tools it is possible to change the pattern, border colour and thickness of layers displayed in TENGRAPH.
Answer:
TENGRAPH Web consists of many layers. In general the further you zoom out the number of layers visible is reduced to make the map clearer and refresh quicker.
Answer:
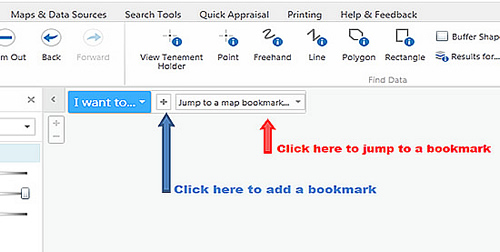
You can save shortcuts to your most commonly visited locations by adding a Bookmark. TENGRAPH Web will allow you to jump to a bookmark previously added.
To add a bookmark for the current extent, click the plus +, enter a name, and then click OK.
Answer:
- Identify a mining tenement on the map.
- Open the "Feature Action menu" by right clicking on the mining tenement number displayed in the Results panel.
- Click on "Open in Google Earth" as shown below.
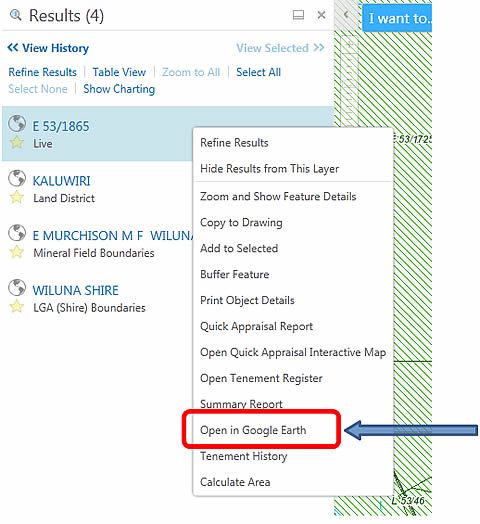
NOTE: You must have Google Earth installed on your computer for this feature to work.
The Department's IT help desk cannot provide technical support in the installation or operation of Google Earth software.
Answer:
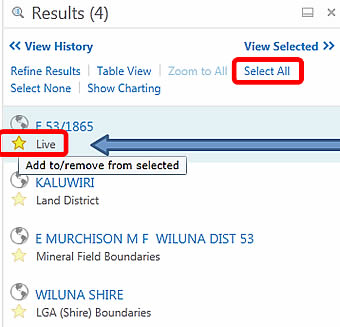
- Identify a mining tenement on the map display.
- Select the mining tenement from the Results (This is achieved by clicking on the yellow star as shown below). Click Select All for multiple tenement selections.
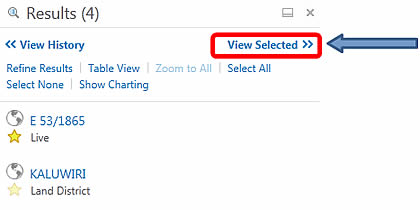
- Click on the "View Selected" tool as shown.
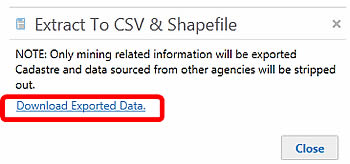
- Click on Export to CSV and Shapefile
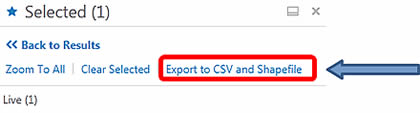
- Click on the Download link and save your file
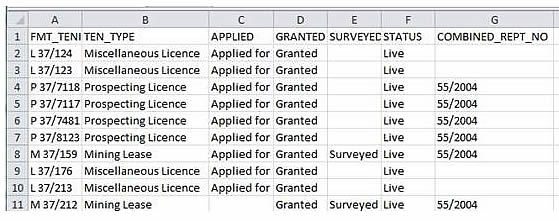
Example of a CSV file (Spreadsheet) exported from TENGRAPH Web
No, GeoVIEW uses a different set of "map services and layers", therefore saved projects are incompatible across the two systems.