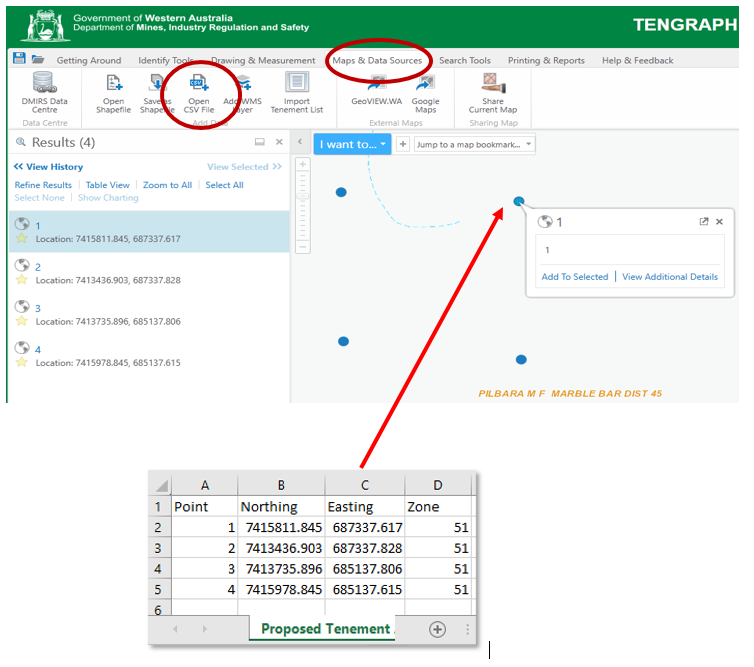
The easiest and quickest way to plot points into TENGRAPH is to upload a csv file saved with MGA coordinates.
- Within TENGRASPH Web, open the Maps & Data Sources Tab toolbar.
- Click on the Open CSV File icon.
- On your PC navigate to the csv file with your saved map coordinates and then click Open.
- A new dialog will open requesting you to select the fields the coordinates are stored. Click the Show Data Preview check box.
- Map the X Axis to the column containing the Easting coordinates and the Northing column to the Y Axis.
- From the Spatial Reference drop down menu, select the MGA Zone you want them plotted, as shown below.
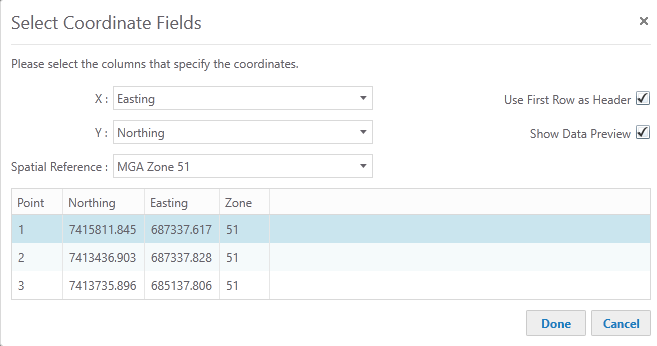
Select Done when your selections have been completed. TENGRAPH will quickly list the coordinates in the results, plot and zoom to them.
The more coordinates you have the quicker this process becomes as it saves having to plot each coordinate individually.
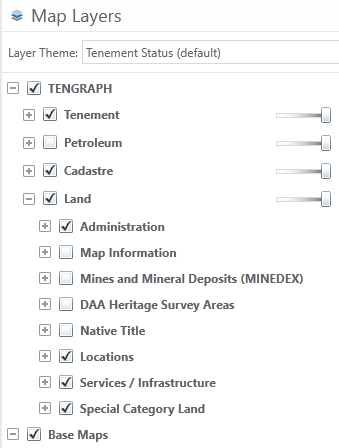
Ensure you have the Cadastre Map layer turned on by ticking the check box
The best way to find out what land affects your area of interest is to create a simple polygon over it and run a quick appraisal. The quick appraisal will list the different land types in the TENGRAPH database that affect the polygon you have created.
Procedure
- Under the Drawing and Measurement tab select the polygon tool and create a simple polygon over the land you are interested in.

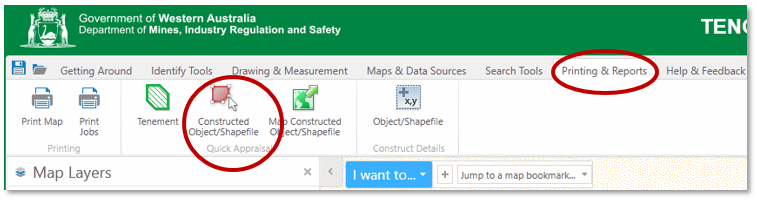
- Open the Printing & Reports Toolbar and select the Quick Appraisal, Constructed Object/Shapefile tool.

- Using your mouse click on your constructed polygon displayed on the map.
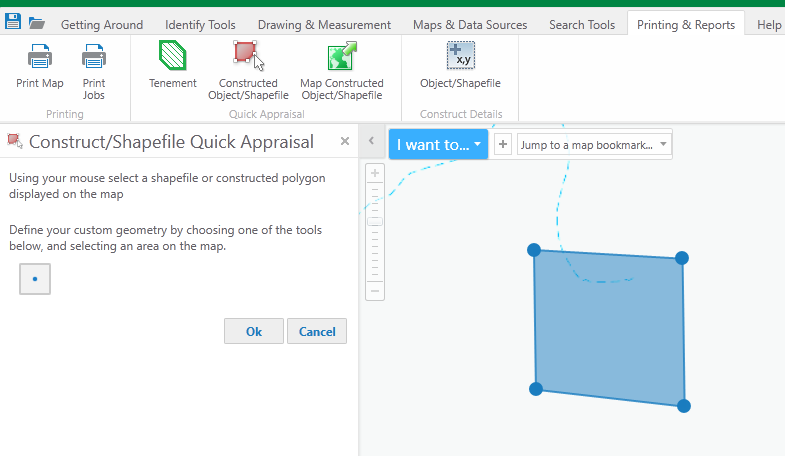
- Select OK.
- Select your appraisal options from the list presented and then press the Continue button.
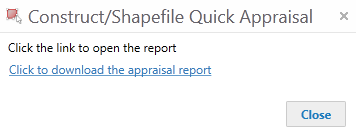
- When the quick appraisal has finished you will be able to download the results and save it as a PDF file.
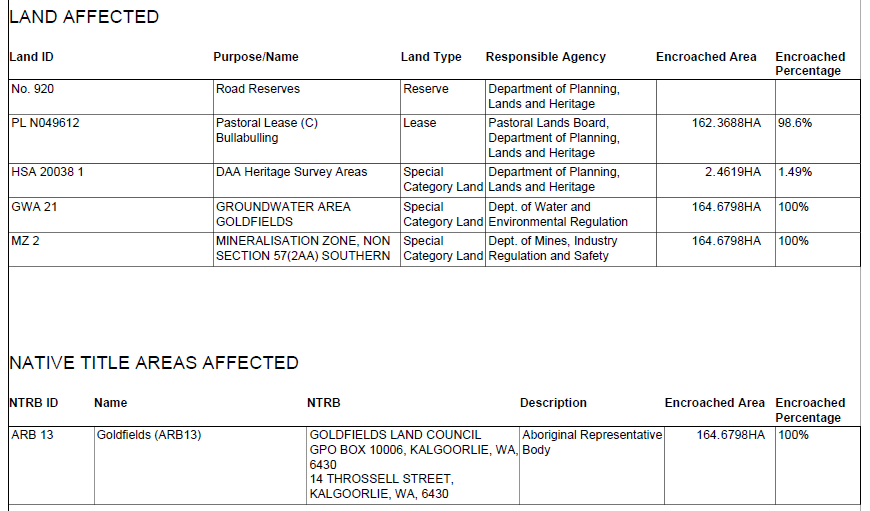
Sample of a Quick Appraisal Report
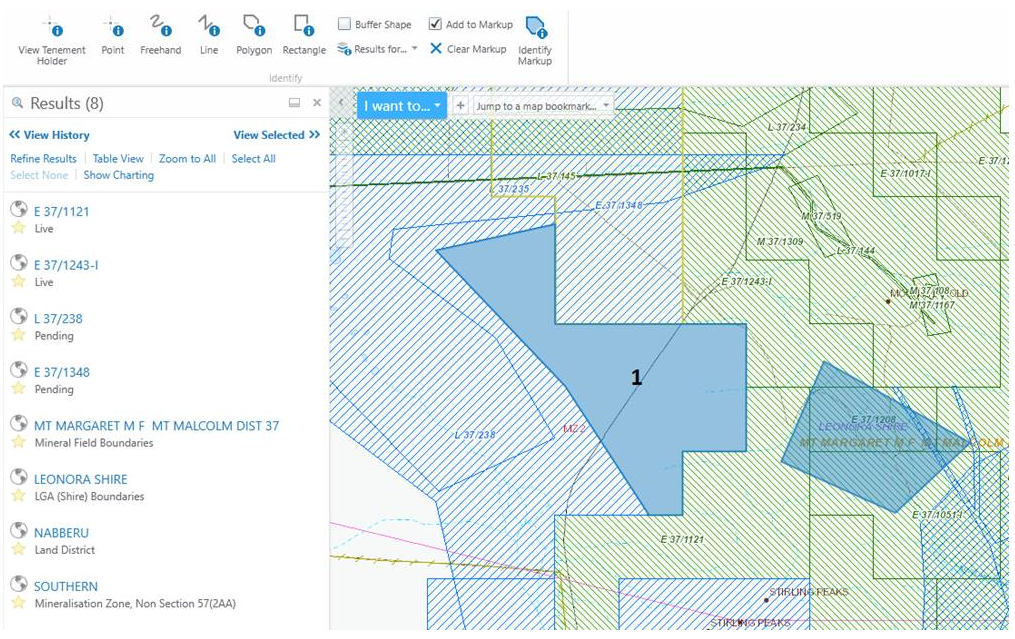
Using the identity tool to define and visualise selection sets
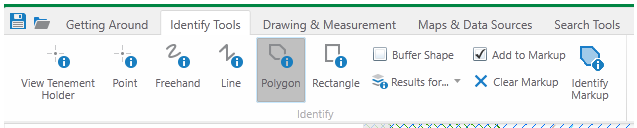
- Select the identify Tool.
- In this example select the 'Polygon'
- Select 'Add to markup'. This will retain the boundary on screen so you can visualise the extent of your query area.
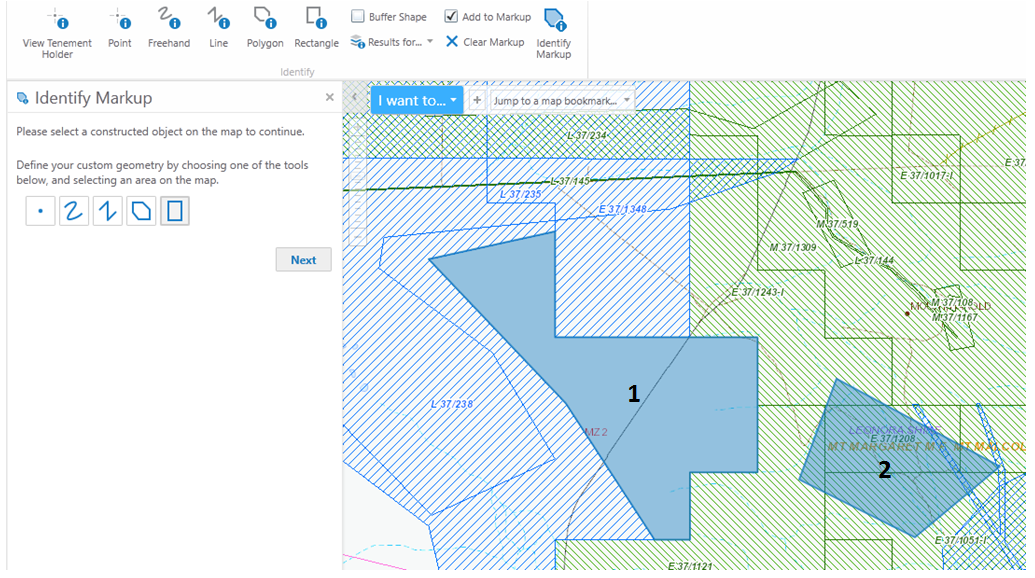
- In the example below the ctrl key was held down to enable precise snapping to the vertices of the tenements for extent 1 and extent 2 was dynamically selected.

- Selection sets for the previous extents can be re-selected by using the 'Identity Markup' tool shown on the identify toolbar.
- Once the 'Identify Markup' is selected you can then identify the which extent you wish to re-identify using the selection tools below.
- Select the construct extent required for the identify (in this case extent 1)
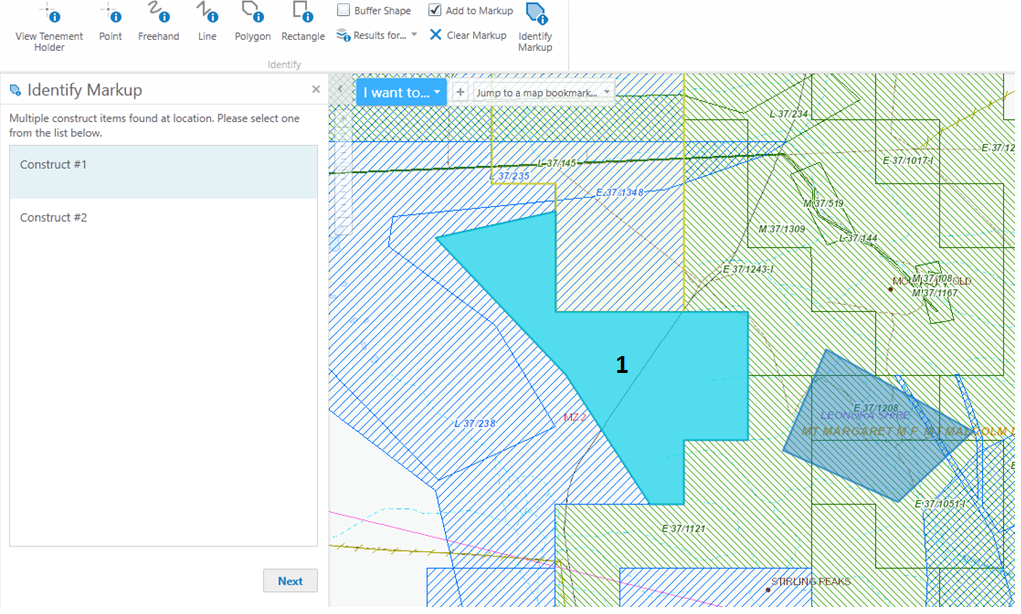
- The identify results for the extent will be shown (in this case for extent 1)