Employment
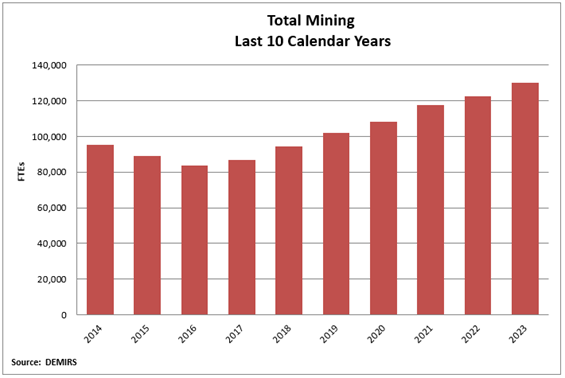
Western Australia’s (WA) mining industry achieved another record level of employment with an average of 130,165 full-time-equivalents (FTEs) in 2023, reflecting strong levels of mining and construction activity in the State.1
This is the seventh consecutive calendar year of growth, the last five of which have been record highs.
The rate of growth also increased to six per cent in 2023, up from 4.3 per cent in 2022.
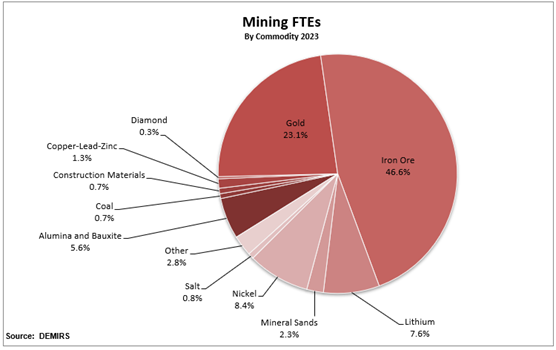
The major contributors to onsite mining employment continued to be the iron ore (60,695 FTEs), gold (30,070 FTEs), nickel (10,920 FTEs), lithium (9,844 FTEs), and alumina and bauxite (7,235 FTEs), industries.
The average number of FTEs on mining operations was up year-on-year for most minerals with the major movers being the lithium (up by more than 4,000 FTEs), nickel (up more than 2,000 FTEs) and rare earths (up by more than 600).
A notable exception was gold which decreased by more than 700 FTEs as some operations were suspended including Dalgaranga, Nullagine, Mt Morgans, and Wiluna while construction was completed at others including Central Norseman, the Thunderbox Mill expansion and the King of the Hills expansion. Copper-lead-zinc also decreased by almost 500 FTEs largely due to the wind-down and cessation of production at DeGrussa.
Employment on mineral exploration sites was an average of 3,934 FTEs, another fall from record levels of more than 4,500 FTEs across 2021 and 2022.
This result, combined with a reduction in drilling metres, may well suggest that the level of exploration activity in WA has peaked in the current commodity cycle.
[1] FTE is the average full-time equivalents. It is based on the numbers of hours worked with an FTE considered to be 2,000 hours worked in a year, 500 hours worked in a quarter, and 166.7 hours worked in a month.
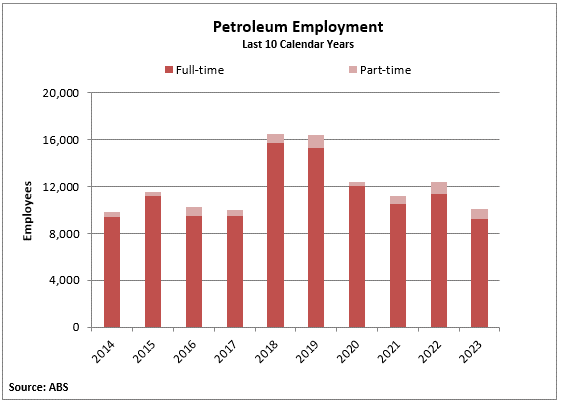
Average employment in the petroleum sector dropped to 10,049 people in 2023, its lowest level since 2017.
This is likely being driven by shorter-term market dynamics including weaker prices, as well as a longer-term reduction in demand associated with global decarbonisation ambitions.
Exploration
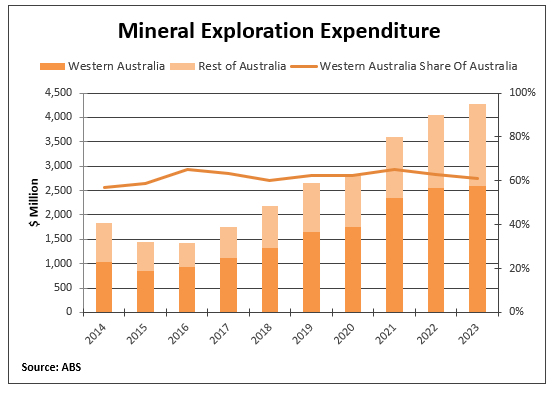
WA’s mineral exploration expenditure continued to grow, reaching $2.6 billion in 2023, the highest value on record.
While exploration expenditure increased in 2023, the number of metres drilled and employment on mineral exploration sites (both indicators of activity) both declined.
This result therefore reflects, in part, ongoing efforts to discover new minerals, as well as the impact of rising costs, particularly for labour, equipment and fuel, within the exploration sector.
Gold, iron ore, and other minerals (including lithium and rare earths), plus nickel/cobalt and copper, were the main target of spending in WA:
- Exploration expenditure for gold was $881 million in 2023, though at its lowest level since 2019.
- Iron ore exploration expenditure increased marginally to $656 million in 2023, its highest level in a decade.
- Other minerals (including lithium and rare earths) exploration expenditure was $547 million almost double from 2022 driven by global forecast demand for EVs and other battery technologies. Exploration for these other minerals is also disproportionately being undertaken in WA compared to the rest of the country.
- Exploration expenditure for nickel and cobalt increased to $282 million in 2023, a new 15-year high and the second highest value on record since 2008, for similar reasons as other minerals.
- Copper exploration expenditure was fairly stable at $186 million.
Spending remained largely focused on brownfields areas or existing deposits with these areas attracting $1.8 billion in spending in 2023, up from $1.7 billion in 2022. In comparison, spending in greenfield locations decreased to $781 million in 2023 from $794 million in 2022. As a result, the share of expenditure on new deposits remained flat at 30 per cent.
This may well reflect a recent interest in exploration on mature ground for commodities which had not previously been targeted such as lithium and rare earths. Brownfields exploration is also lower cost than greenfield exploration, which means it is likely to be favoured in the current higher cost operating environment.
WA remained the leading destination for exploration investment in Australia. It accounted for 61 per cent of the national spend in 2023, which is around its long-term average.
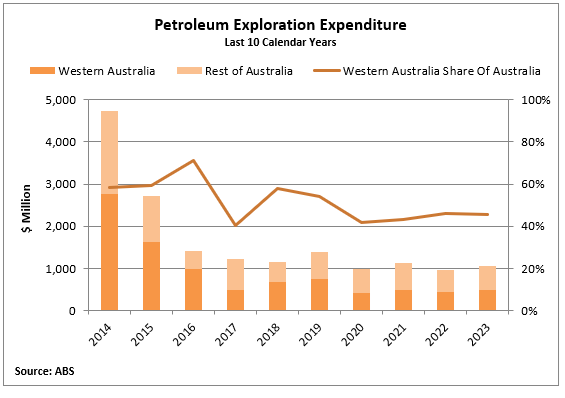
Petroleum exploration expenditure in WA rebounded from some of its lowest levels in a quarter of a century to be valued at $482 million in 2023. However, it remains at a low level and in a state of decline.
This was largely due to an upswing in petroleum exploration spend in the September and December quarters, with a drilling program by INPEX Corporation in the Browse Basin related to the Ichthys project, as well as in the Perth Basin at South Erregulla (Strike Energy), Beharra Springs (Beach Energy and Mitsui & Co), and Lockyer Deep (Mineral Resources).
WA’s share of national petroleum exploration expenditure was 45 per cent, up from its lowest ever level in 2022-23 but still well below its peak of 15-years ago.
This was on account of petroleum exploration expenditure increasing by more than the rest of Australia due to a reduced spend in the Northern Territory.
Investment
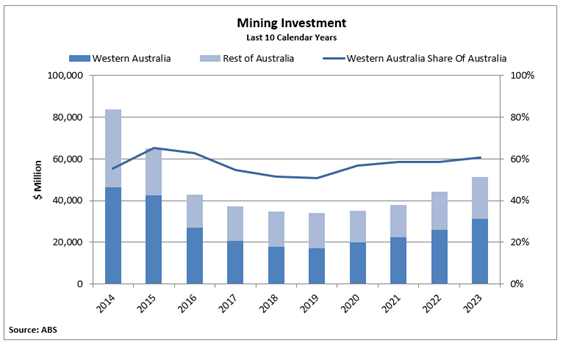
More than $31 billion was invested in WA’s mining and petroleum sector across 2023.
This result continues the overall upwards trend in investment since mid-2019.
At the same time, the rate of growth in investment spending is increasing and was more than 20 per cent between 2022 and 2023.
Investment trended higher across 2023, reaching more than $8.9 billion in the December quarter and its highest level since the tail-end of the mining investment boom in 2015.
This result was supported by ongoing construction on major LNG projects including Woodside Energy’s Scarborough/Pluto project and Shell’s Crux project, as well as major iron ore developments including Onslow and Western Range. New investment is also underway, including Albemarle Corporation’s Kemerton lithium refinery expansion. The increases also likely reflect cost pressures with a range of resources projects reporting higher capital costs over the past year.
The level of spending is, however, still only roughly two-thirds of the investment during the peak of the mining investment boom a decade ago.
WA’s share of national mining and petroleum investment increased from recent years to 61 per cent, reflecting a higher rate of growth in spending in WA compared to the rest of the country.
This is higher than the 10-year average, but below previous highs of 60 to 70 per cent during the tail-end of the mining investment boom.
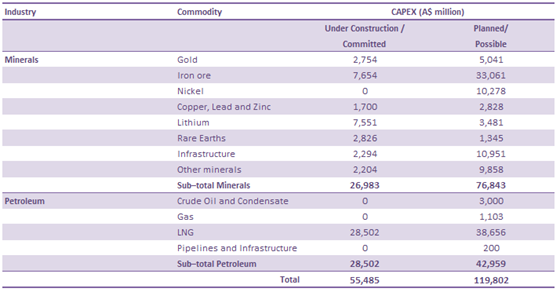
The resources sector was again the major contributor (72 per cent) to total new capital expenditure in WA, though its share remained below the peak of greater than 80 per cent during the mining investment boom. The Department of Energy, Mines, Industry Regulation and Safety also monitors and collects information on mineral, petroleum, and associated infrastructure projects in the investment pipeline, and estimates the capital value of these projects.
Analysis of this information shows that as of March 2024 there were $55.5 billion in projects committed and under construction, up marginally from $54.6 billion in September 2023.
This was due to Final Investment Decisions on BHP’s Western Ridge iron ore project and Rio Tinto’s Gudai-Darri iron ore expansion, while Gold Fields’ St Ives renewable energy project and Evolution Mining's Mungari Mill Expansion commenced construction. There were also higher capital costs reported for several projects including, most notably, the Iluka Resources’ Eneabba rare earths refinery and Liontown Resources’ Kathleen Valley lithium, as well as a new capital cost estimate for Woodside Energy’s Julimar/Brunello Phase 3.
These developments were partially offset by the completion of several projects under construction including:
- Lynas Corporation’s Kalgoorlie Cracking and Leaching plant;
- Bellevue Gold’s namesake gold project;
- Northern Star Resources’ Thunderbox Mill expansion;
- CPB Contractors' Port Hedland Wind Fence;
- BHP Nickel West's Northern Goldfields Solar project;
- Woodside Energy’s Pyrenees Infill Phase 4 crude oil; and
- Strike Energy's Walyering domestic gas.
At the same time, IGO placed its Cosmos nickel development project into care and maintenance.
The major projects under development as of March 2024, and that continued to support investment spending, were:
- Woodside Energy’s Pluto LNG expansion and Scarborough gas;
- Shell’s Crux LNG;
- Chevron’s Jansz-Lo Compression Project;
- Mineral Resources’ Onslow iron ore;
- Rio Tinto’s Western Range project;
- Northern Star Resources’ KCGM Mill and Fimiston South expansions;
- Albemarle’s Kemerton lithium refinery expansion;
- BCI Minerals’ Mardie salt and potash;
- BHP’s West Musgave nickel-copper project;
- Iluka Resources’ Eneabba rare earths refinery;
- Covalent Lithium’s Kwinana lithium refinery;
- BHP’s Western Ridge iron ore, Fortescue’s Pilbara Transmission and Generation;
- Mitsui & Co and Beach Energy’s Waitsia Stage 2; and
- Liontown Resources’ Kathleen Valley lithium.
The estimated capital cost of medium to longer-term possible and planned projects (i.e., undergoing scoping, pre-feasibility and definitive feasibility study) was $120 billion, up by around $27 billion from September 2023.
The increase was almost entirely due to new capital expenditure estimates for iron ore projects already in the pipeline, including Hardey, Nyidinghu, Ridley Stage 1, Cashmere Downs, Yogi, and Mount Ida.
There were also several new projects that entered the pipeline, including Green Steel WA's Mid-West Hydrogen Direct Reduced Iron plant, Widgie Nickel's Mt Edwards nickel, Auking Mining’s Koongie Park nickel, Impact Minerals' Lake Hope high purity alumina, Reward Minerals' Carnarvon potash, plus Woodside’s Energy’s Pluto LNG Solar Farm.
Several upward revisions in capital expenditure estimates also took place, most notably for the Hemi (Mallina) gold project, plus new estimated capital costs for Victory Bore manganese and Lockyer Deep gas.
Principal resource projects
Western Australia’s mining industry consisted of 134 predominantly higher value and export-oriented mining projects in 2022-23, up from 129 in 2021-22 and the highest number since DEMIRS began tracking projects on this basis in 2014-15.
The most notable change in the mining industry during 2022-23 was the entry of two new mineral sands projects into the production phase: Strandline Resources’ Coburn project and Australian Garnet’s Lucky Bay garnet project. With these new projects, the total number of mineral sands projects increased to 10 from eight in the previous financial year.
Western Australia also had its first potash project achieve first sales from the Beyondie project in July 2022. The owner and operator of the project, however, Kalium Lakes, subsequently had Receivers and Managers appointed in August 2023.
There were 33 iron ore projects in 2022-23, one less than the 34 projects in 2021-22, a result following the suspension of both the Ridges and Mid West projects in late 2021 and the start-up (and subsequent suspension) of the Paulsens East project in September 2022.
While the number of gold projects was stable at 52, the gold industry had the greatest degree of turnover and activity.
There were six re-started gold projects in 2022-23. Four were short-term campaign mining operations – Aurrenne Group’s Parker Range, Focus Minerals’ Coolgardie, Greenstone Resources’ Burbanks, and Lukah Mining’s The Mount. Two were continuous, longer-term, operations – Northern Star Resources’ Bronzewing and Pantoro’s Norseman.
Six principal gold projects from 2021-22 were either under the threshold (i.e. they did not produce more than 2,500 ounces of gold) or did not operate in 2022-23.
Considerable merger and acquisition activity meant that several gold projects changed hands in 2022-23, including:
- Catalyst Metals acquired Superior Gold, the owner of the Plutonic project;
- Genesis Minerals acquire Dacian Gold, the owner of Mt Morgans;
- Newmont Corporation acquired Newcrest Mining, the owner of Telfer; and
- Gascoyne Resources, the owner of Dalgaranga, changed its name to Spartan Resources.
Several gold projects were suspended or entered care and maintenance during the financial year including the Dalgaranga, Halls Creek, Mt Morgans, Tampia, and Vivien project.
An additional copper-lead-zinc project was added following the start-up of Abra Mining’s Abra project. This brought the total number of copper-lead-zinc principal projects to four, however, the DeGrussa project reached the end of its life during the financial year and the Jaguar project was suspended in September 2023.
The number of nickel projects in Western Australia increased to nine this year, up from eight in 2021-22, due to the addition of BHP Nickel West’s Cliff project as a standalone project (it had previously been considered part of Mt Keith).
There was also an additional silica sand project (bringing the total to three) with Simcoa’s operations achieving more than $5 million in sales (up from less than that threshold in 2021-22) for the financial year.
The State’s mining industry also comprised hundreds of quarries and small mines in 2022-23 that largely produced the basic raw materials required for the local construction or agricultural industry. Such materials include clays, construction materials (aggregate, gravel, rock and sand), dimension stone, gypsum, limestone, limesand and spongolite. There were nine principal producers of these materials in 2022-23.
In 2022-23, there were 15 major mineral processing operations that transformed bauxite into alumina; gold doré into gold bars; nickel ore into nickel concentrate (through toll treatment) and nickel concentrate into nickel matte, nickel powder, nickel briquettes, and nickel sulphate; rutile and synthetic rutile into titanium dioxide pigment; zircon into fused zirconia; silica sand into silicon metal; and spodumene concentrate into lithium hydroxide.
This was one higher than the 14 in 2021-22 with the Kemerton lithium hydroxide plant progressing through commissioning and achieving on-specification and customer qualified product in April 2023.
Western Australia’s petroleum industry consisted of 19 projects that produced oil, gas and condensates from 49 fields in onshore and offshore areas of the State in 2022-23.
Many of these petroleum projects had associated processing plants for LNG exports and domestic gas sales.
This was down from 20 projects and 51 fields in 2021–22.
The Jingemia oil project was removed as it has been shut-in since July 2020.
The number of fields declined in 2022-23 due to the removal of Jingemia, as well as the conclusion of production from the Persephone and Wanaea fields at the North West Shelf. The Redback and Redback South fields at the Beharra Springs project also concluded.
The offshore Lambert Deep field (part of the Greater Western Flank Phase-3 project for the North West Shelf), and the Spartan field (part of Varanus Island) entered production during the financial year.
For an overview of how Western Australia’s major commodities performed, please see major commodities review 2023.