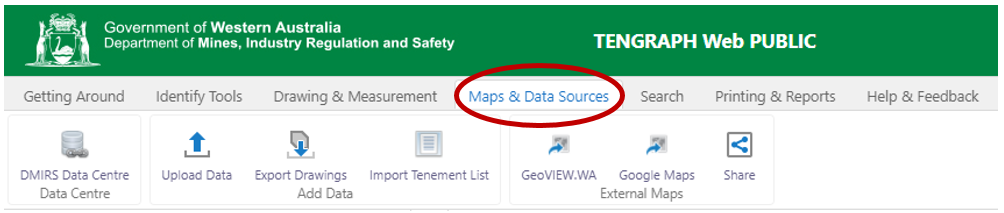
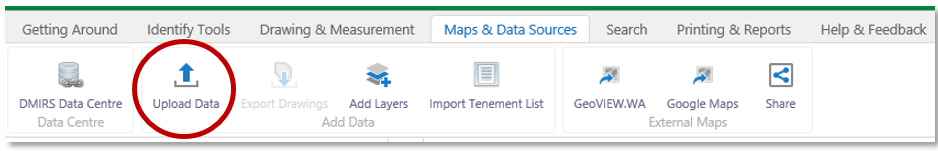
The Maps & Data Sources toolbar contains tools that add information to TENGRAPH Web. It also provides links to other mapping and data systems.
|
Use this tool... |
To... |
|
|
Open the Department's Data and Software Centre where spatial datasets and software (including mining tenement files) are available for download. |
|
|
Upload a csv, xlsx or Shape file, from your computer for display and analysis in TENGRAPH. Ensure you select all the relevant (*.shp, *.shx, *.dbf, *.prj) files, not just the *shp when choosing your shape files to upload from your computer. Below this table is further information on uploading your own coordinate data for display in TENGRAPH. |
|
|
Export and save drawings as a shapefile. In TENGRAPH Web you are able to save any constructed object that you create, to your computer in the form of a shapefile. All constructed drawings are deleted when TENGRAPH is closed. Saving them allows you to retain any constructed objects that may be of further use. |
|
|
Upload a text file from your PC containing a column of Formatted Tenement IDs directly into the Results List. |
|
|
Open GeoVIEW.WA in a new tab displaying your current TENGRAPH map extent. GeoVIEW.WA is a departmental GIS system that uses similar software as TENGRAPH. It contains Geophysical data and imagery not displayed in TENGRAPH. |
|
|
Open in a new tab, the current TENGRAPH map locality in Google Maps. Refer to the FAQ on how to view mining tenements in Google Earth. |
|
|
Share the current map view with another TENGRAPH Web user. You can email a link to a colleague that will open their TENGRAPH session in the same locality. |


Uploading Coordinates (Auto plotting feature)
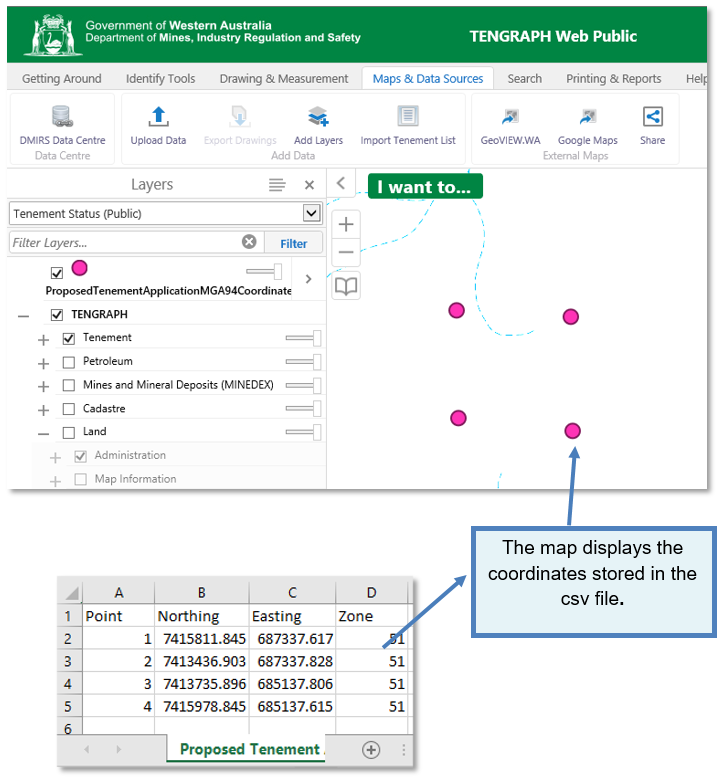
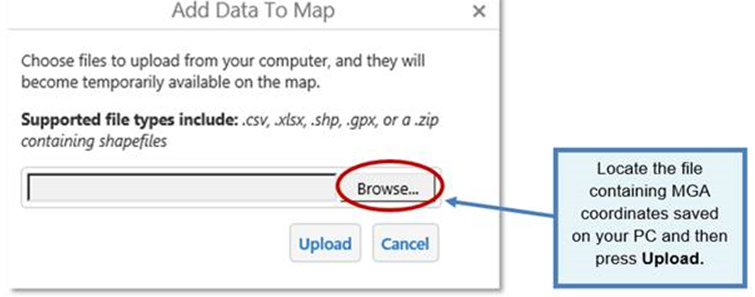
Where a list of coordinates already exist in a CSV, XLSX or zipped shapefile format, it is possible to add them directly onto the map display. This is a faster method than manually plotting points, one coordinate at a time.
An example could be coordinates saved for a new tenement application in a csv format.
- Open the Maps & Data Sources Tab toolbar
- Click on the Upload Data icon and follow the on screen prompts.
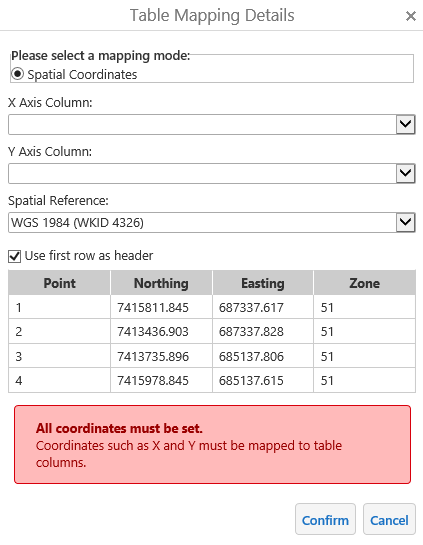
- Map the X Axis to the column containing the Easting coordinates and the Northing column to the Y Axis
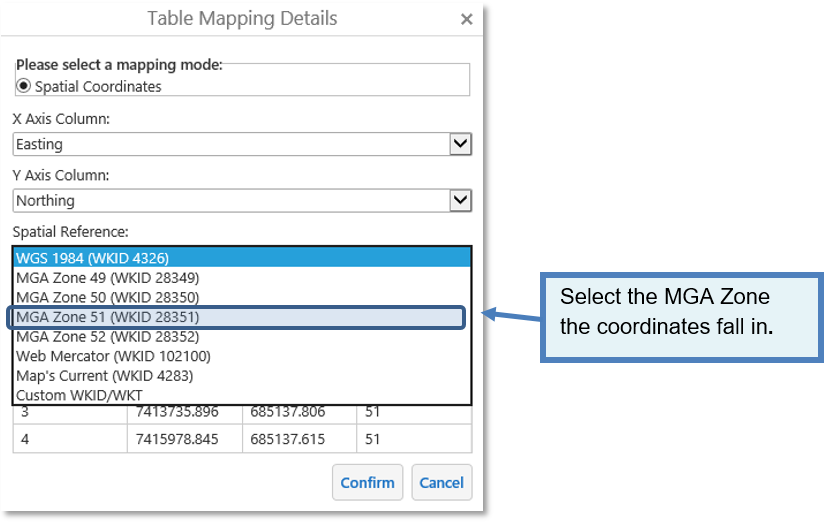
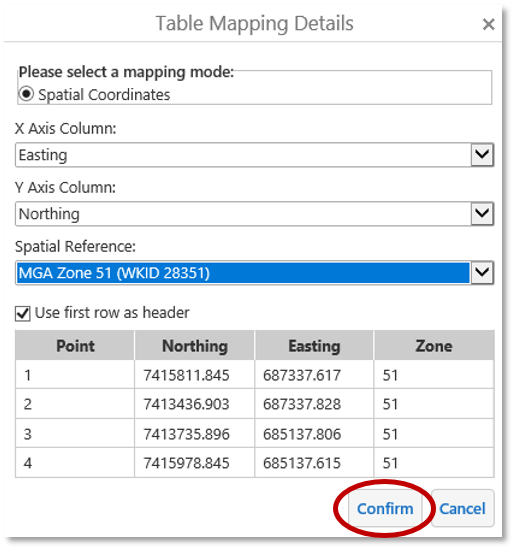
- Press Confirm and Proceed when the ready.
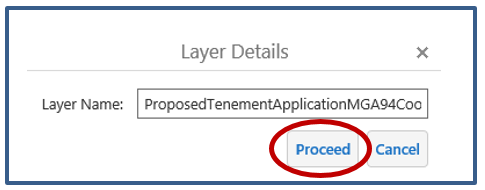
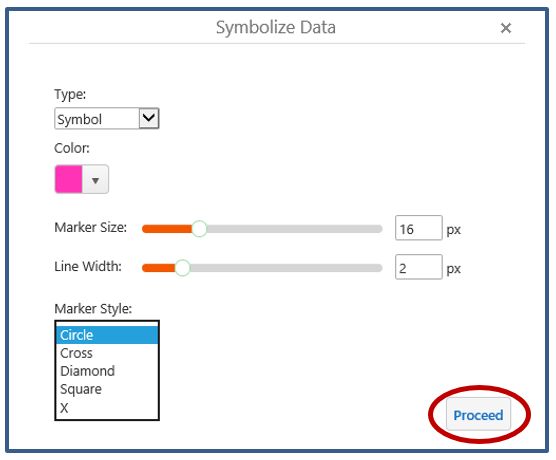
- Select a colour from the Smbolization display options and press the Proceed button.