Frequently Asked Questions (FAQ) - Operational
The most common FAQs of an operational nature that have been received from users in relation to the TENGRAPH Web system are listed in this section.
These FAQs include:
Use the tenement search tool conveniently located at the top on the ![]() menu.
menu.
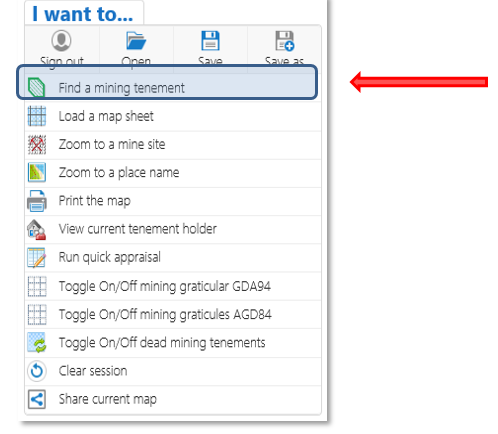
Most of the frequently used TENGRAPH search tools are found here.
- Click on the
 icon to open the menu.
 - Select Find a mining tenement from the menu.
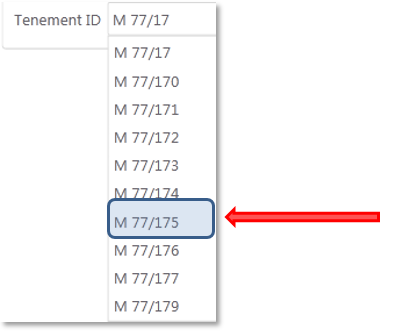
- Enter a tenement number in the search panel provided.
Note: A space between the tenement type and the district number is required for the search to work. e.g. M 77/175
- From the list presented, select a mining tenement.
-
Click on the search button
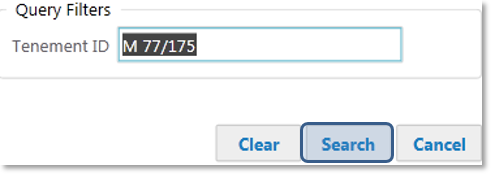
- The system will list the tenement Id in the Results panel and Highlight its boundries on the map.
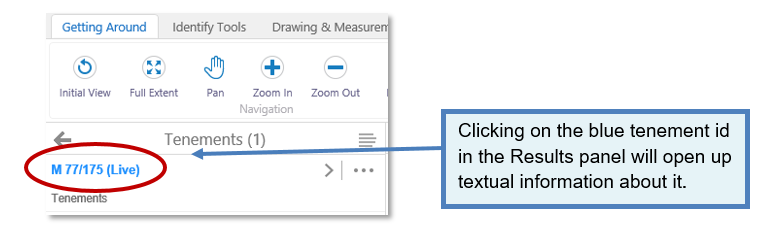
To find tenement information such as the grant date or holder details you will need to open the information window.
-
Identify a mining tenement using one of the Tenement Search, or
 i button Identify Tools. A summary of the affected land will appear in the side Information Panel.
 - Expand the Results by clicking on the relevant mining tenement group with your mouse.
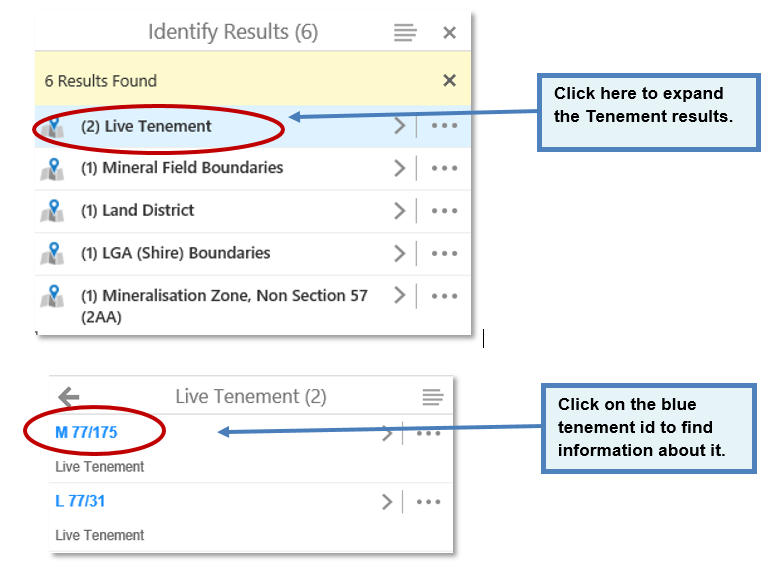
- Click on the tenement id. A new window will open displaying tenement information.
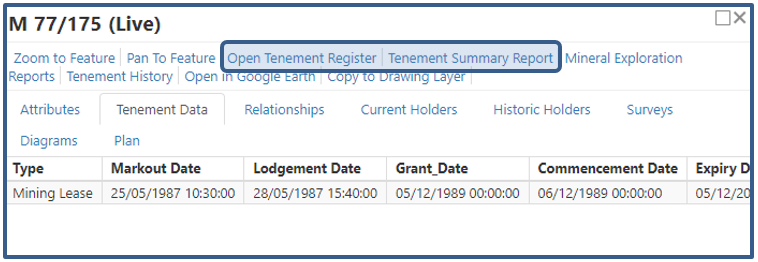
- Within the tenement window click on the relevant tabs to find information.
- The Tenement Summary Report will print out basic tenement information.
- For detailed tenement information, open Mineral Titles Online by clicking on Open Tenement Register.
Create a polygon using the Polygon Measurement tool and then print a Quick Appraisal and object construction details report.
-
Within TENGRAPH Identify an area of interest
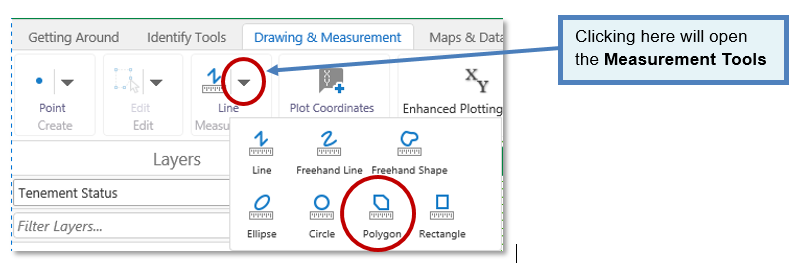
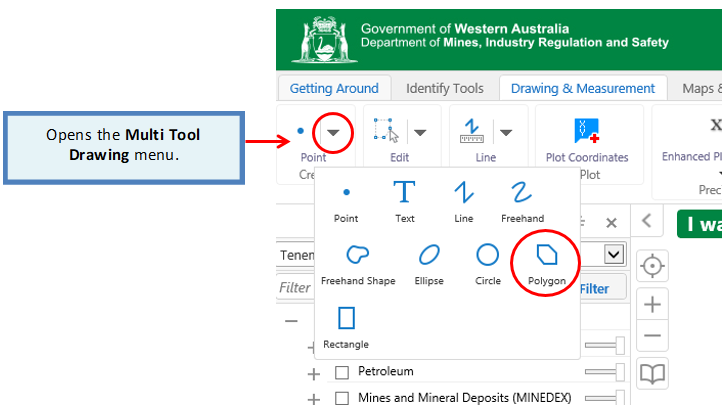
- Open the Drawing & Measurement Tab
- Select Polygon from the Measurement multi tool group.
- To precisely draw polygons, Enable the Snapping Tool by clicking on the icon.
Note: Snapping to points or shapes is not supported on hand held devices.
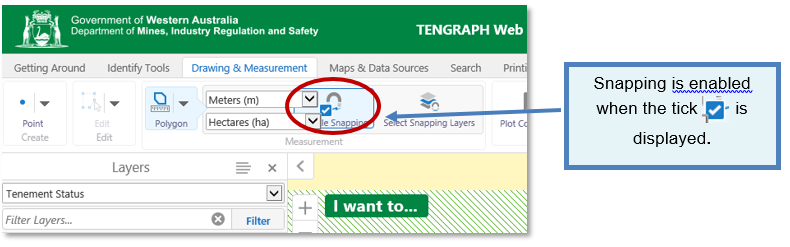
- When enabled the mouse pointer will snap to the nearest point, vertex or edge near the mouse pointer.
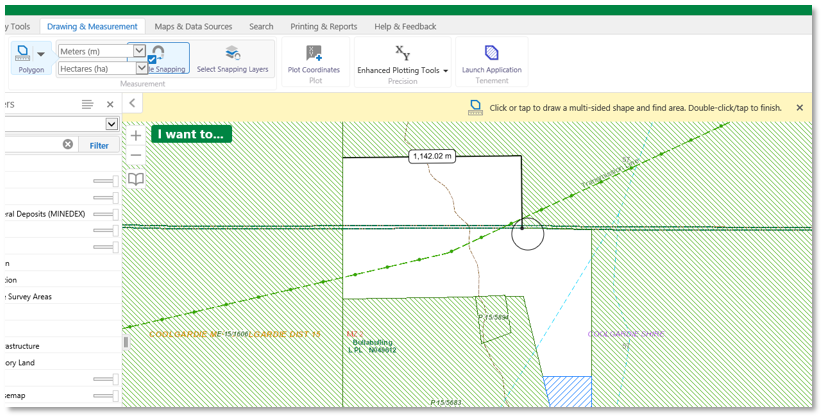
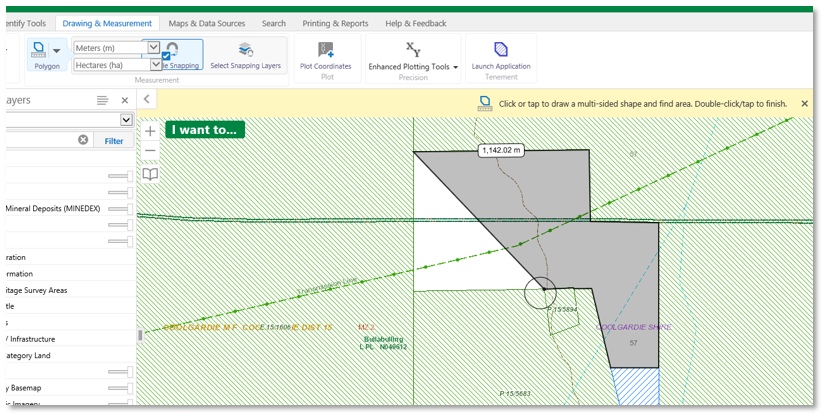
- Continue clicking to form the corners of the polygon. You do not have to complete the shape as long as the shading covers the land you want.
- Complete the polygon by double-clicking. The polygon area is shown on the map display.
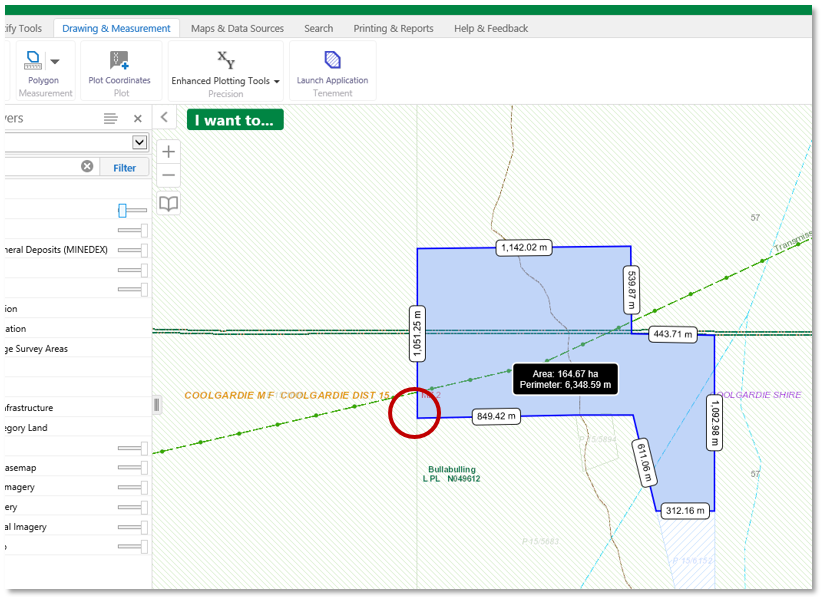
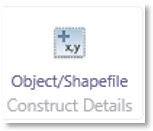
- To print the polygon coordinates open the Printing & Reports toolbar and select the Object/Shapefile Construct Details icon.
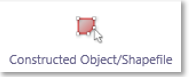
- To print out what land the polygon affects click on the red Constructed Object/Shapefile icon.
- Follow the on screen prompts and open your PDF print when it is has finished.
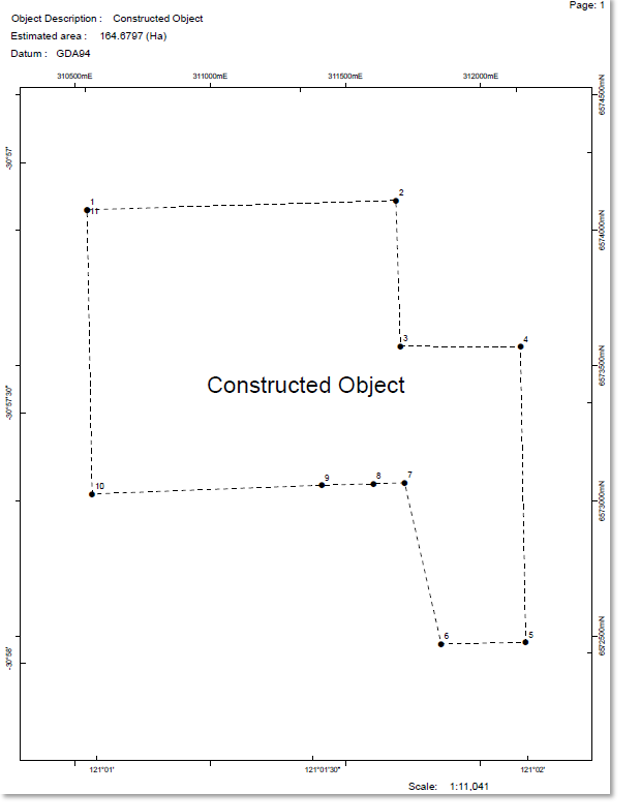
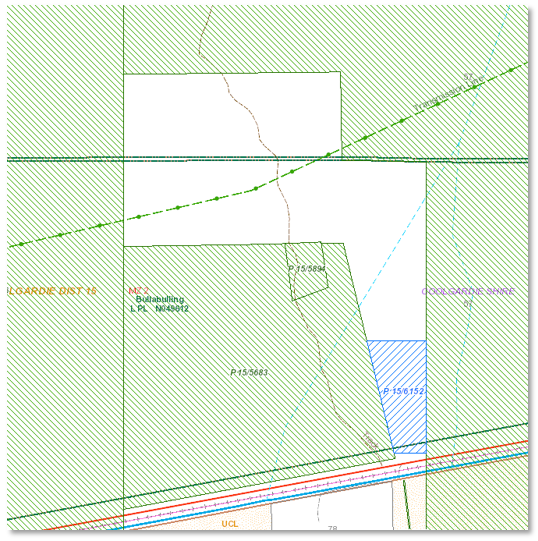
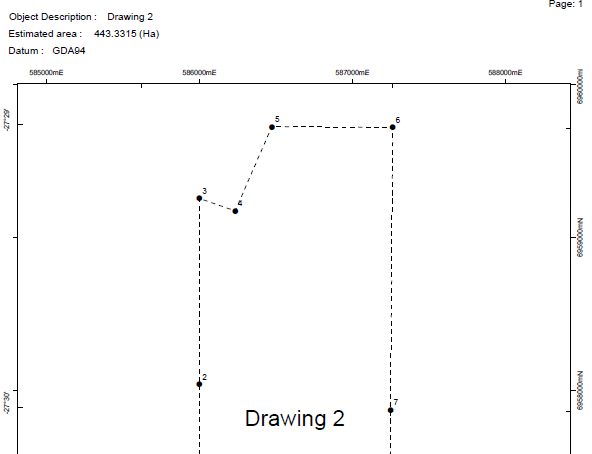
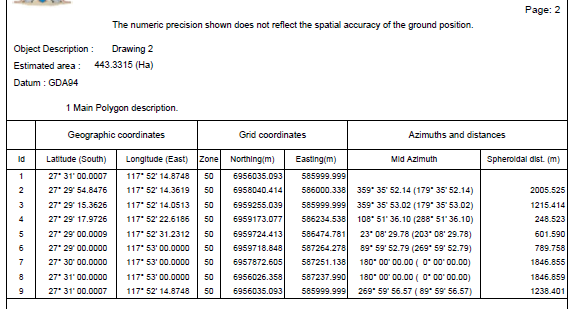
Example of a Print Constructed Object Details PDF file.
Example of Constructed polygon Quick Appraisal.
No, GeoVIEW uses a different set of "map services and layers", therefore saved projects are incompatible across the two systems.
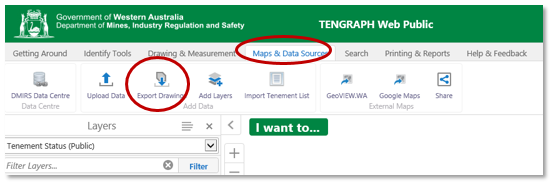
Use the Export Drawings tool.
-
Open the Maps and Data Sources tab
-
Select the Export Drawings icon and
-
Press OK and save your zipped (*.shp, *.shx, *.dbf, *.prj) shapefile to your computer.
1. Export results to CSV, XSLX or shapefile formats.
- To save a set of results as a shapefile, CSV or XLSX file from a valid search or map selection open the
 summarized Action Menu.
 - From the menu select the format you want to save the results in.
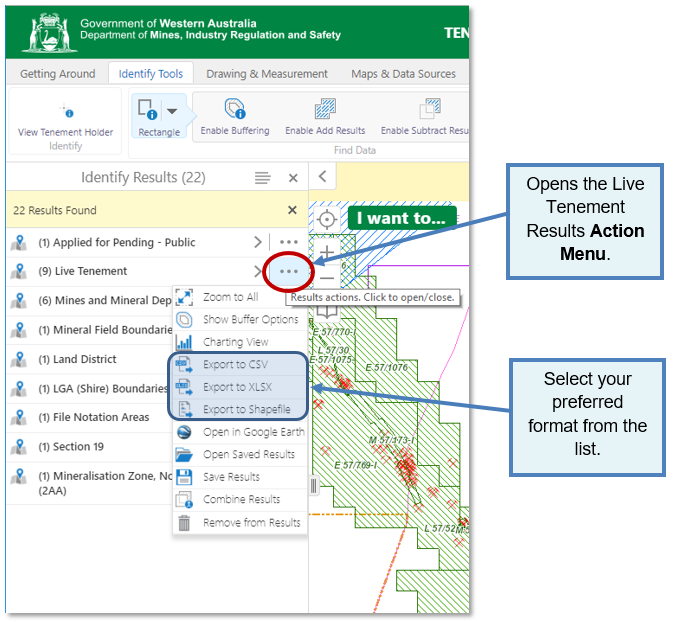
- The results are downloaded on your device in the chosen format.
Only DMIRS information can be exported. Cadastre or other data sets sourced from other agencies cannot be exported from TENGRAPH.
If you require digital extracts from another agency please refer to the Acknowledgements document for contact details.
State wide tenement and other DMIRS related data sets are available for download from https://dasc.dmp.wa.gov.au/dasc/
2. Save Results
- To save a set of results from a valid search or map selection open the Action Menu.
- Select Save the Results from the menu.
Saved Results only persist for the duration of your browser session. If you refresh or close the browser, you will lose all Saved Results.
To save results across sessions, save them within a project.
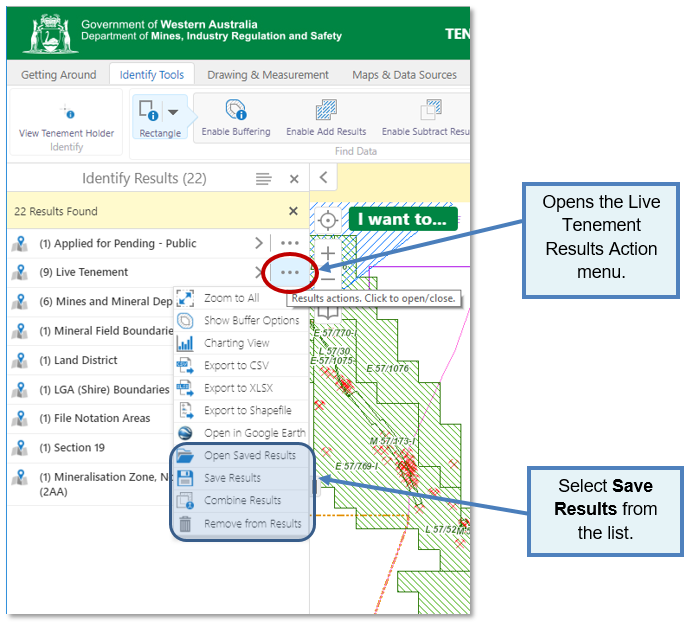
You can only open one set of saved results at a time. You can add or remove features either through the Actions Menu shown above, or via a link in a feature's map tip. You can also modify the current results by using the Combine Results option to either: add saved results, subtract saved results, or match intersecting saved results.
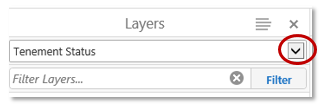
Use the Filter field shown in the Layers panel.
In the Filter input field, type name of the required layer. The layer list is updated to match or contain the text in the Filter field.
E.g. Locate the Aboriginal Heritage Surveys Map Layer.
- Type Heritage into the Filter Layers ... window.
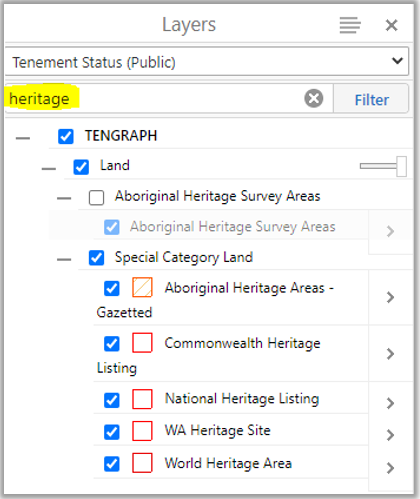
- As you type the Layers panel is filtered matching the typed text.
- Locate and select Aboriginal Heritage Survey Areas in the Layer panel.
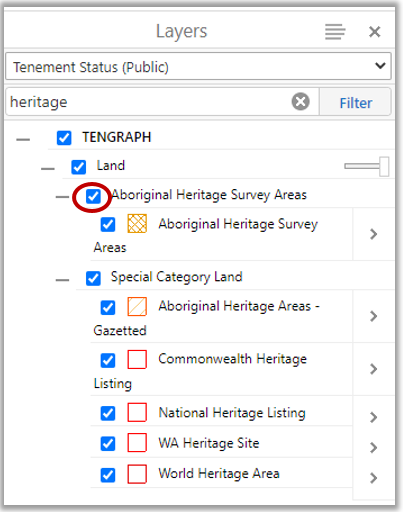
- Zoom to a map scale where the layer is visible.
- Aboriginal Heritage Survey Areas are displayed on the map with an orange fill pattern.
- This Filter technique can be used to find any TENGRAPH Web map layer.
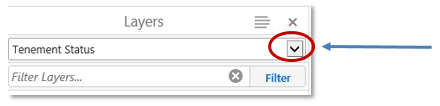
- Clicking on the cross
 will return the Map layer list to the original format.
The default TENGRAPH theme portrays tenements as either live (in a green colour) or pending (in a blue colour).
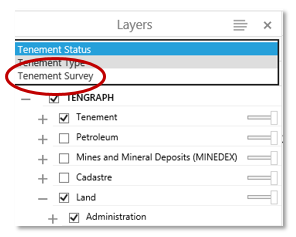
Selecting a different Layer Theme will colour tenements by their type or survey status.
To view surveyed tenements open the Layer Theme drop-down menu from within the Layers Panel and click on Tenement Survey as shown below.
Dead and live surveyed tenement boundaries are drawn on the map with a solid line. Standard Survey Marks are also shown.
Unsurveyed live and pending tenement boundaries are portrayed with a broken line.
Selecting the Tenement Status option will change the settings back to the original map layers display.
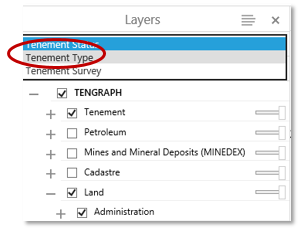
Selecting a different Layer Theme will colour tenements by their type or survey status.
To visualize tenements by type open the Layer Theme drop-down menu from within the side Layers Panel and click on Tenement Type as shown below.
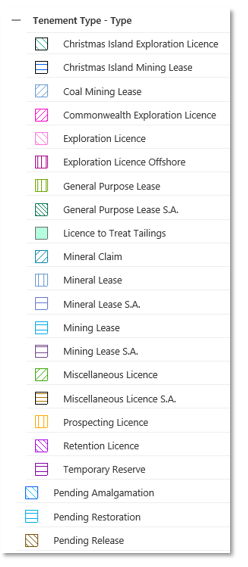
Current tenements are coloured on the map by their type as shown in the legend below.
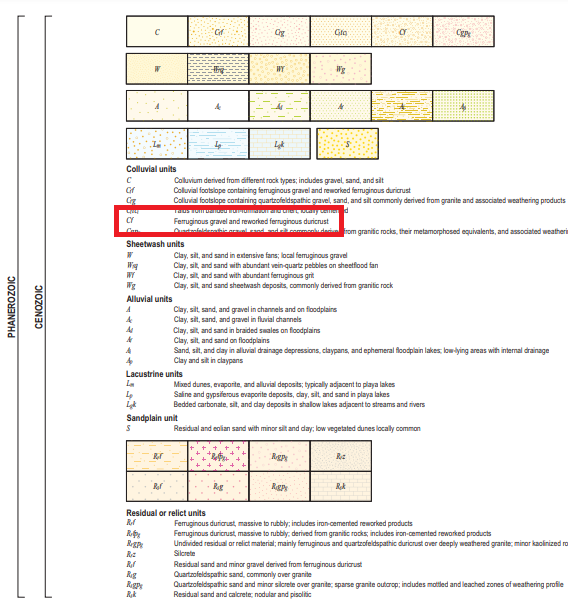
The Geology mosaics displayed in TENGRAPH are comprised of several separate maps stitched together.
Each map may use different geology abbreviations and descriptions.
There is a downloadable scanned legend in PDF format available for every published geological map sheet.
The following steps will help you find the correct legend for the geology in your area of interest.
Procedure:
In TENGRAPH Web ensure the Mapsheet index referring to your scale of geology (1:100,000 or 1:250,000) is turned on. The Geology index layers are found in the Land folder and will need to be expanded as shown below.
1:100,000 Geology layer set up
.png)
A simpler way is to type geol into the Filter Layer input field. The layer list is updated with the layer names that match or contain geol.
.png)
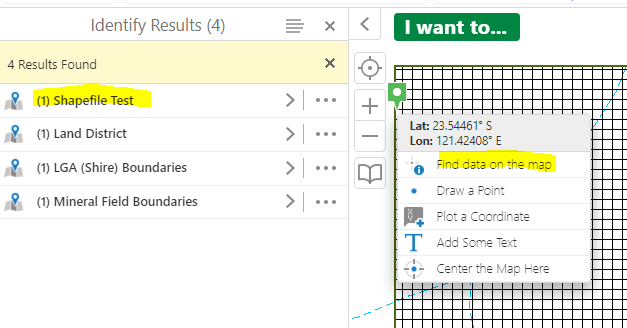
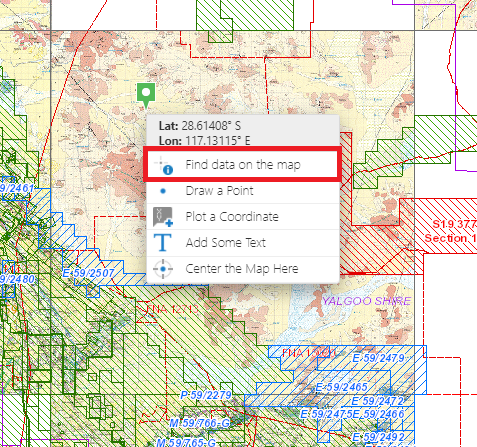
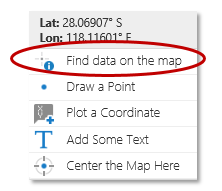
Once the Geology Imagery Mosaic and the corresponding Geological Digital map index layers are ticked on, as shown above, right click on the map display and select the Find data on the map option.
The layers affected are listed in the results. Expand the results by clicking on the Geological Digital Index result.
.png)
Open the information window by clicking on the blue 1:100 000 map number shown in the left panel.
Open the Links tab and select a link as shown below in red.
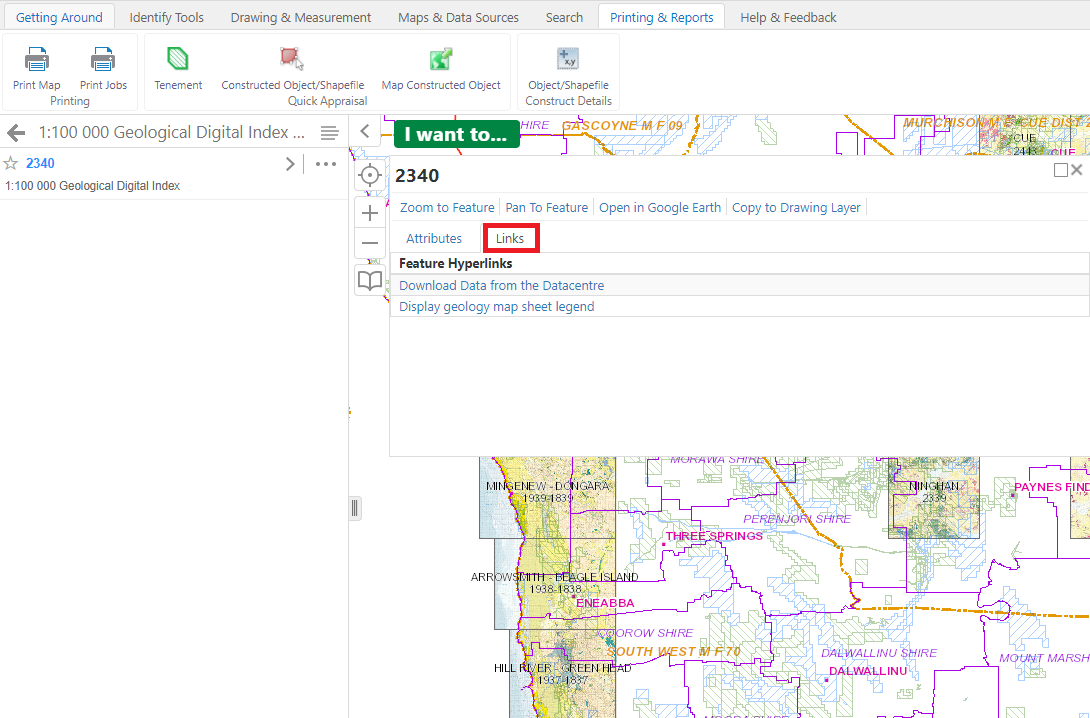
Part example the Map Legend affecting "Thundelarra" 1:100 000, Sheet Number 2340.
1:250,000 Geology layer set up
Use the same process as above but with the 1:250,000 Geology Imagery Mosaic and the 1:250,000 Geological Digital map index layers ticked.
Hint: Remember to filter the layers panel by typing geol in the Filter, as shown below. Clicking on the cross ![]() will return the Layer panel to the original list.
will return the Layer panel to the original list.
.png)
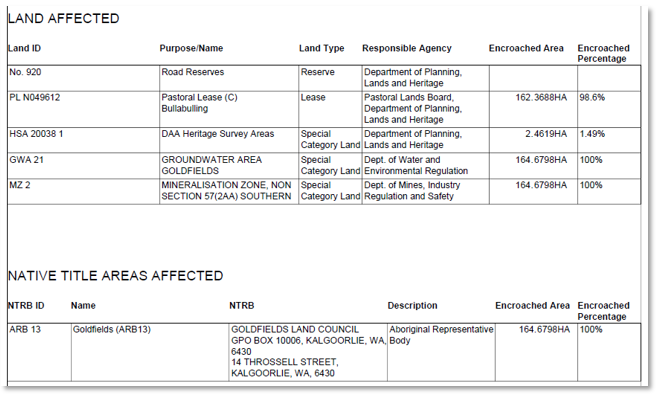
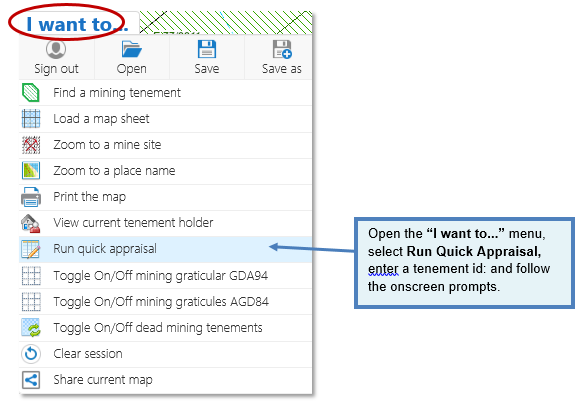
The best way to find out what land overlays a mining tenement is to download a Quick Appraisal PDF Report.
-
Click on the
icon to open the menu.
- When the Quick Appraisal report is ready it will appear in the information panel
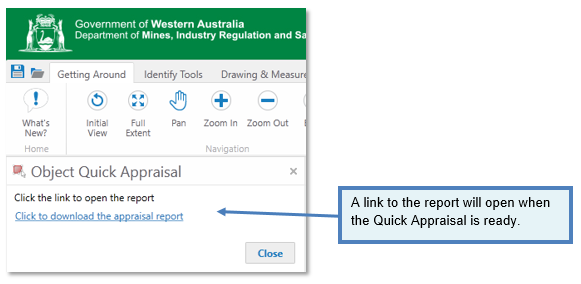
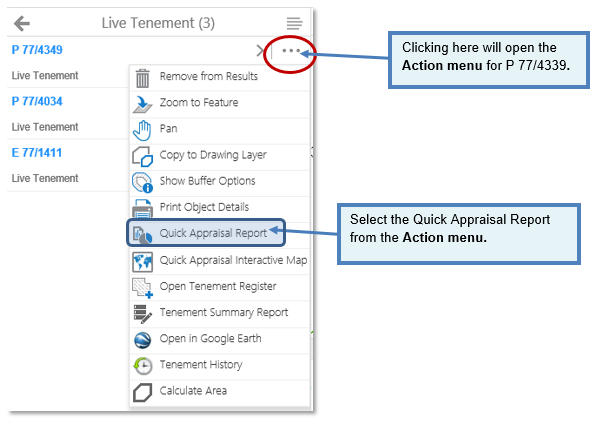
- Tenement and polygon Quick Appraisals are also accessed from the results Action menu shown in the information panel.
Note:
![]() The Quick Appraisal Interactive Map highlights affected land intersections on Google maps.
The Quick Appraisal Interactive Map highlights affected land intersections on Google maps.
The Copy to Drawing tool is used to change the colour of a feature displayed on the map.
- Identify a tenement on the map and expand the results.
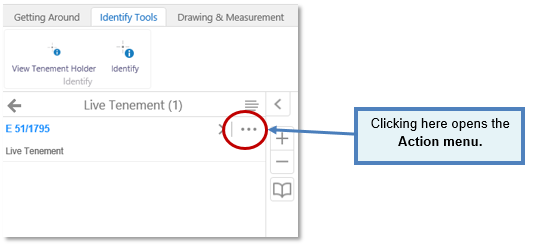
- Open the tenement action menu
 as shown below.
- Select Copy to Drawing Layer from the Action drop down menu.
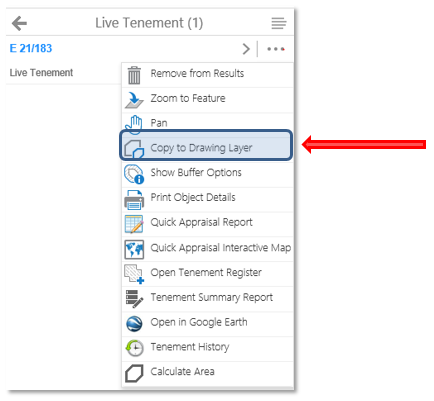
- A blue polygon identical to the mining tenement is created on the map drawing layer.
Sometimes referred to as markup.
Use the polygon Edit tool to change the style.
The Styles tool allows you to change the drawing's colour and pattern.
- On the main toolbar Click on the Drawing & Measurement Tab.
- Open the Create multi drawing tool menu and select Polygon.
- Select Edit and then the blue polygon on the map you wish to change the colour, transparency or thickness.
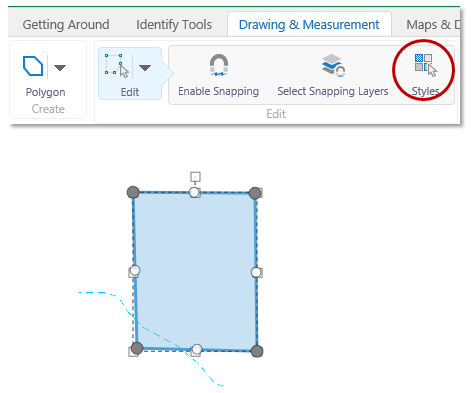
- With the drawing highlighted click on the Styles icon.
- Choose a different style from the options presented.
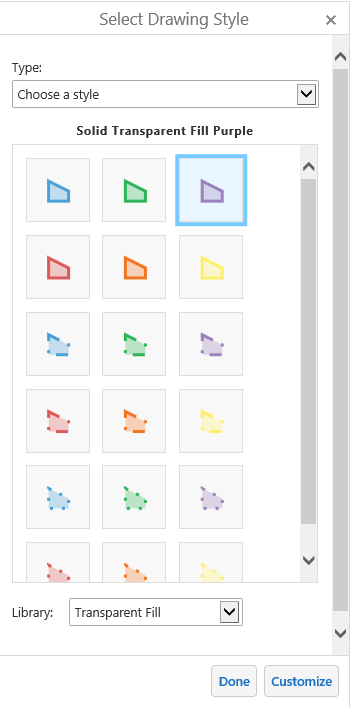
- Select Done when you have finished.
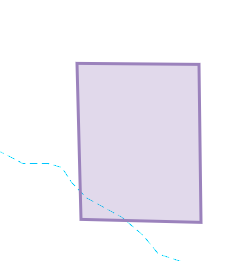
- The selected polygon on the map is refreshed with the new style.
- Select Customize if you want to create your own style.
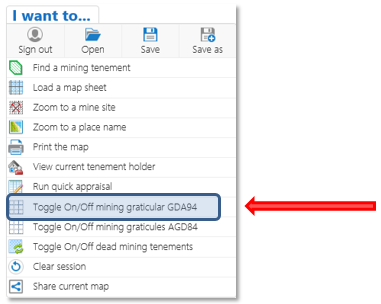
Turn on the GDA map layer and use an identify tool.
- Using the TENGRAPH navigation or search tools, locate a live Exploration Licence on the map display.
- Open the menu and toggle on the GDA mining graticules.
- Move your mouse over a graticule block on the map you would like to identify. A right mouse click will open the Context menu shown below.
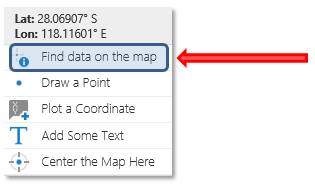
- Click on the Find data on the map menu option
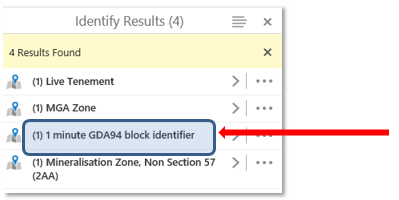
The Results based on your mouse position are summarised in the information panel.
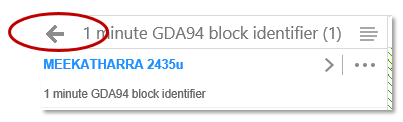
Click on the 1 minute GDA block identifier shown below.
A description of the graticule block identified is displayed in the panel.
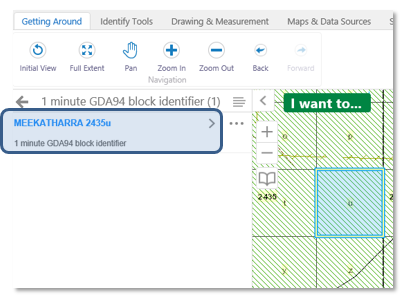
- Clicking on the
 Back arrow will return you to the summarised results.
Use the "Create graticule polygon and description" tool to print the blocks identified.
- Click on the Drawing and Measurement Tab.
- Click on the Enhanced Plotting Tools icon to open the drop down menu.
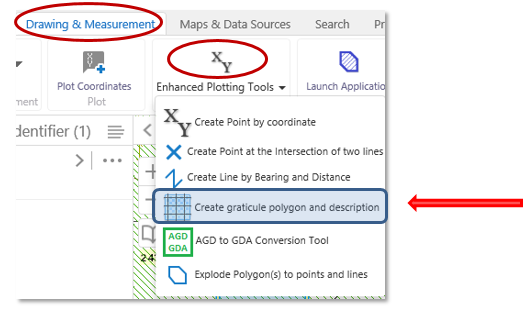
- From the drop down menu click on Create graticule polygon and description. This will open the Graticular Selection Tool in the left panel.
- Use your mouse to click on a block(s) displayed on the map. The block selected will be coloured on the map. Re-clicking a block will remove it from the selection.
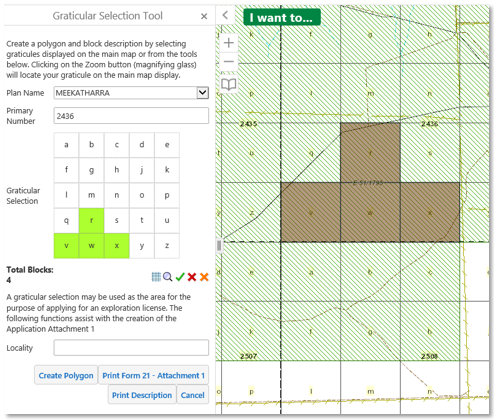
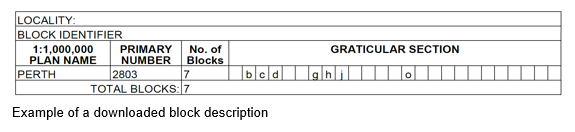
- When finished with your block selections click on the Print Description button.
- Click the Download link to open the block(s) details.
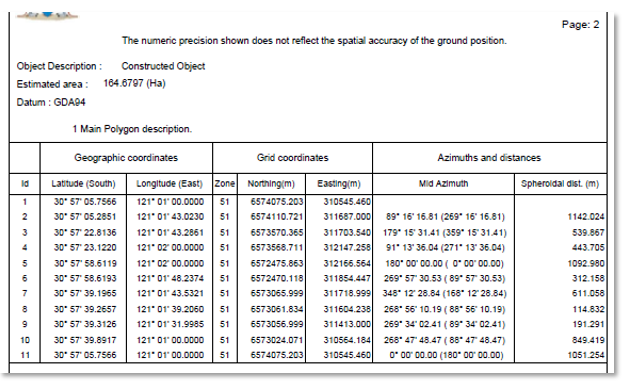
Use the Print Object Details Report. A PDF containing boundary coordinates details of a mining tenement (as plotted in TENGRAPH) a constructed polygon or downloaded shapefile is available from the Print Object Details Report.
- Open the Context Menu (Right mouse click over a mining tenement, constructed polygon or downloaded shapefile displayed on the map).
- From the options presented click "Find data on the map".
-
Any features displayed (including polygon drawings shapefiles etc) on the map are summarized in the Results panel.
-
Expand the Results by clicking on them.
-
Open the Action menu as shown below.

-
Select Print Object Details from the menu.
-
Open the tenement coordinate details (constructed polygon details or downloaded shapefile object details) print job when finished.
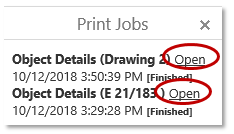
Example of Print Object PDF report
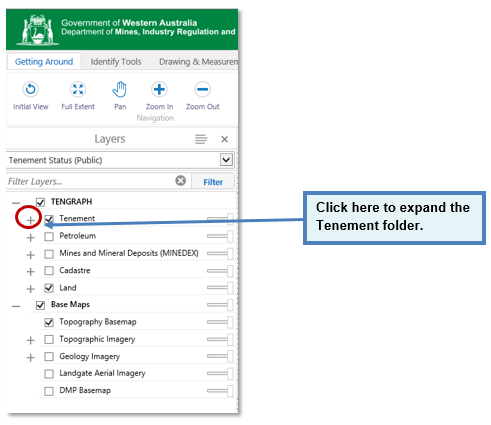
Beside each layer or folder name in the Map Layers List, there is a check box that is used to turn the layer on or off.
- To view cadastre on the map display ensure the Cadastre folder is ticked on.
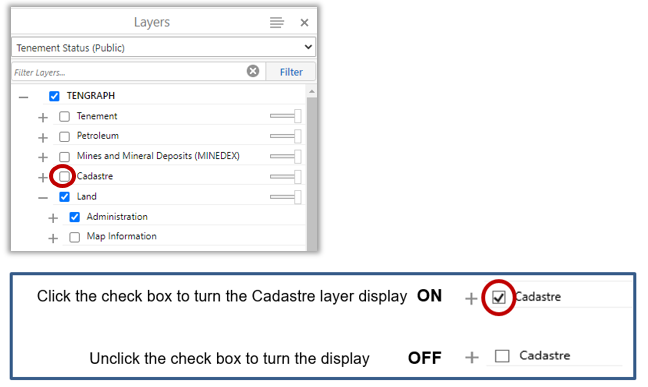
- The Cadastre is scale dependant. This means you will have to zoom in for freehold land to become visible.
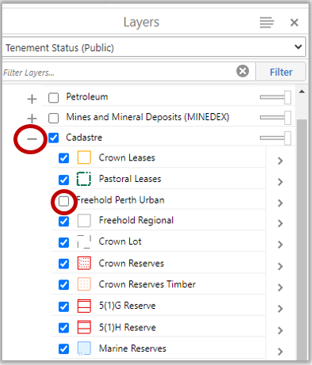
- Freehold Land within the Perth Urban area is not displayed by default.
- For freehold land in the Perth metropolitan region, expand the Cadastre folder and turn on the Freehold Perth Urban map layer as shown below.
PLEASE NOTE:
1. The TENGRAPH Cadastre display is refreshed from Landgate approximately once every three months.
2. It is provided for information purposes only and is not guaranteed. For the latest Cadastre please refer to Landgate.
3. Where the information is being used for legal purposes then the original documents must be searched from Landgate.
Turn on one of the Topographic Mosaics.
- Expand the Topographic Imagery Folder.
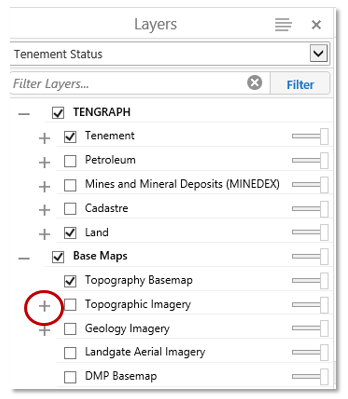
- Turn on one of the topography mosaics layer display.
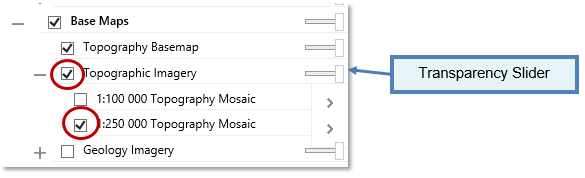
The map display is refreshed with topography imagery. Use the Slider bar to adjust the transparency.
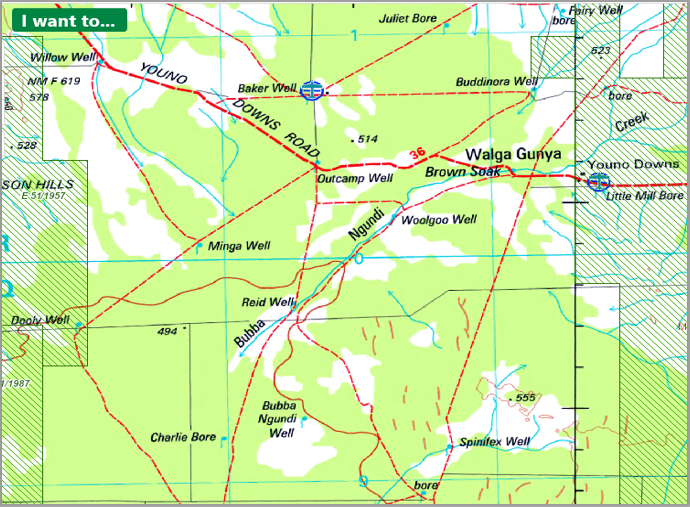
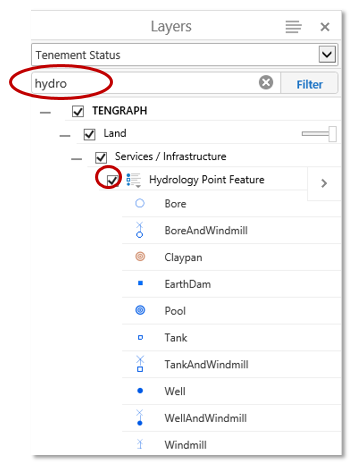
Another option is to turn on the Hydrology Point Feature Map Layer.
- Type Hydro in the Filter window and turn on the Hydrology Point Feature layer. This layer is more suitable for large-scale mapping.
Un-surveyed mining tenement coordinates and area calculations obtained from TENGRAPH are intended as a guide only and may not reflect the accuracy of the ground position.
Coordinates associated with surveyed tenement boundaries are accurate but are subject to minor adjustment due to improved survey and data maintenance procedures
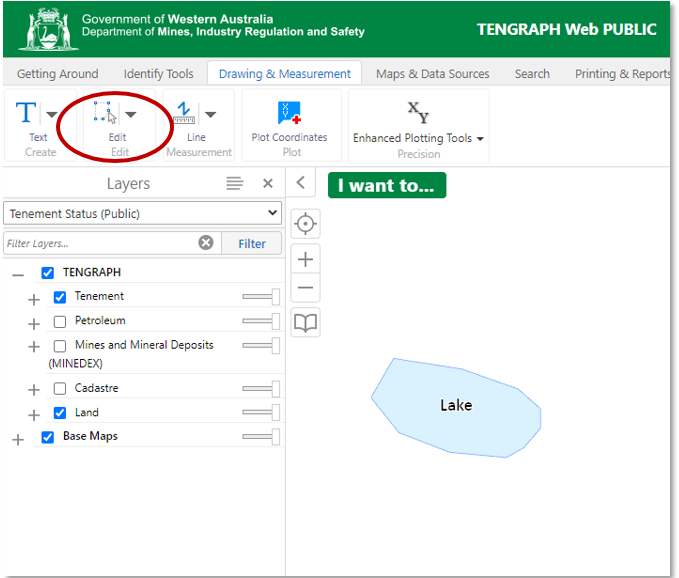
- Click on the Drawing & Measurement Edit Tool
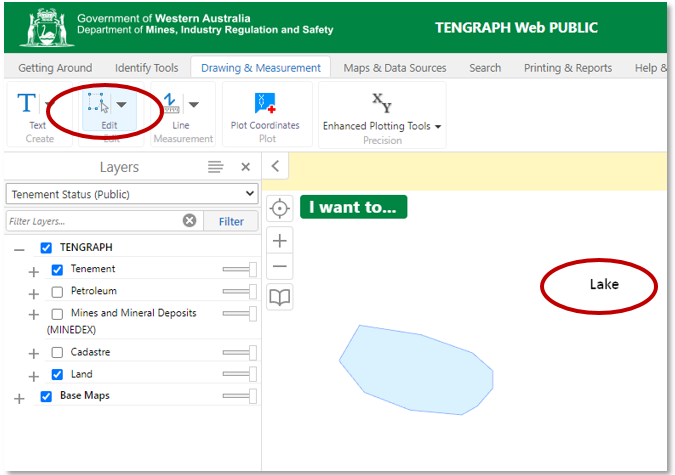
- Left mouse click over the text you want to move.
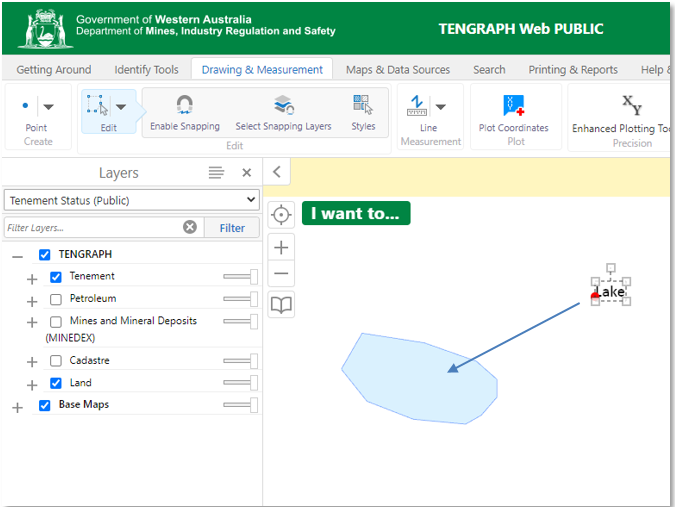
- While still holding the left mouse button move the mouse pointer to a new position.
- The text will move with the mouse position.
- When you are satisfied with the new location, release the mouse button.
- Re-click the Edit button to finish.
Click here for more information on editing drawings.
The visualisation options allow users to change the colour, pattern and transparency of any layer displayed in TENGRAPH.
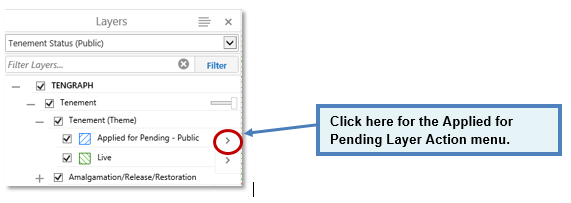
1. Within the Map Layers panel, expand the Tenement folder and Tenement (Theme) layers until the Applied for Pending and Live tenements become visible. Alternately, use the Filter map layers tool to locate a map layer.
2. Open the Layer Action menu ![]()
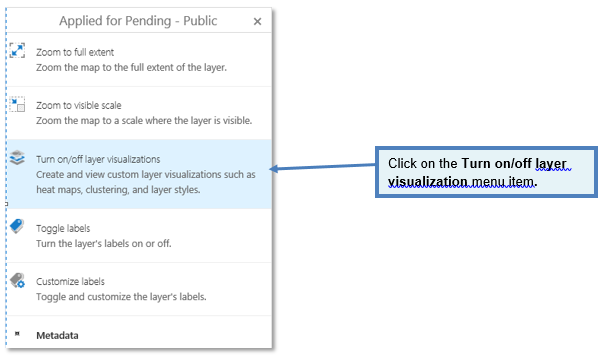
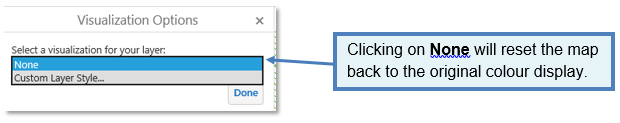
3. From the Visualization Options panel you are able to change the layer symbolization shown on the map.
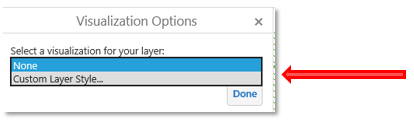
4. Select Custom Layer Style in the drop-down menu.
5. Select Simple under Choose Symbology Type.
Symbology type
-
Use the Line Width slider or click the numeric field and click the up/down arrows to change the pixel setting for the line width.
-
Use the Line Style list to choose from solid or dot and dash lines.
-
Use the Fill Style list to choose from a solid or patterned fill style.
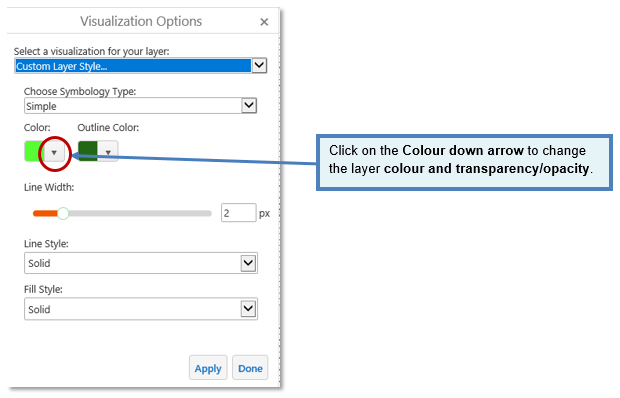
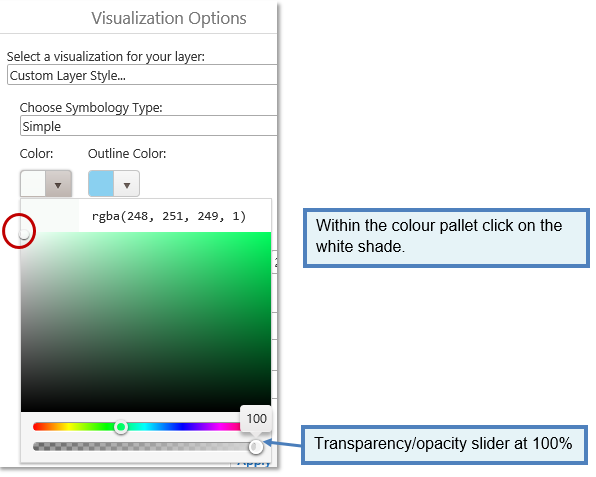
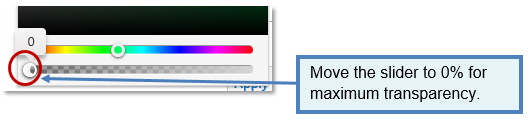
6. Change the transparency/opacity setting to permit underlying layer features to show through, click the down arrow under Color and set the slider setting to less than 100% and click Apply.
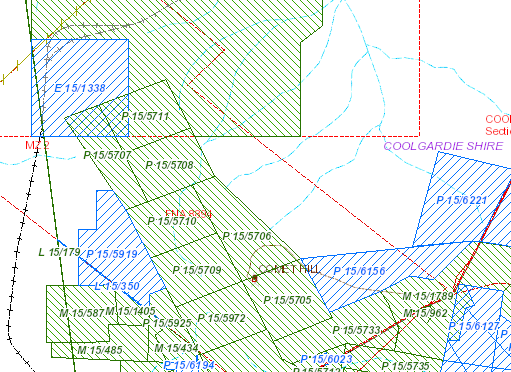
The map display before applying visualisation changes.
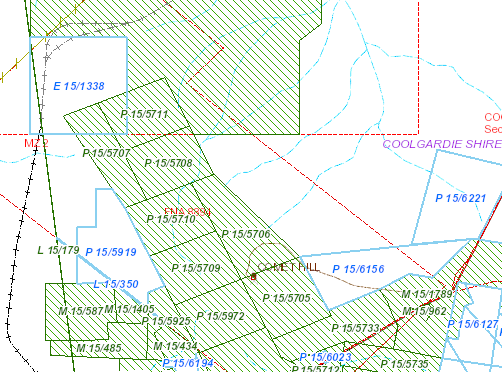
To remove the green pattern for live tenements open the Visualisation options and repeat the process.
TENGRAPH Web consists of many layers. In general the further you zoom out the number of layers visible is reduced to make the map clearer and refresh quicker.
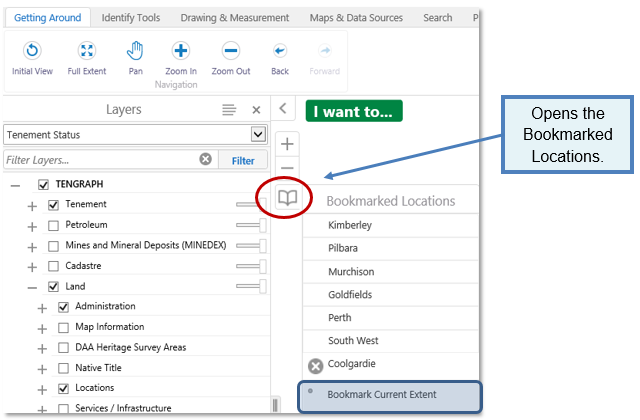
You can save shortcuts to your most commonly visited locations by adding a Bookmark. TENGRPH Web will allow you to jump the map to a bookmark previously added.
- Open the Bookmarked Locations by clicking in the
 Bookmark icon.
 - Permanent bookmarked regional locations are shown for WA.
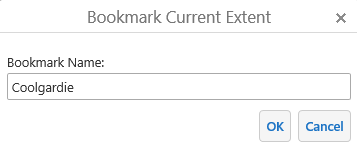
- To save click on Bookmark Current Extent.
-
Give your location a name and click OK
-
The location is added to your list for personal use.
- With your mouse, Right click over a mining tenement displayed on the map.
- Select "Find data on the map" option from the Context menu.

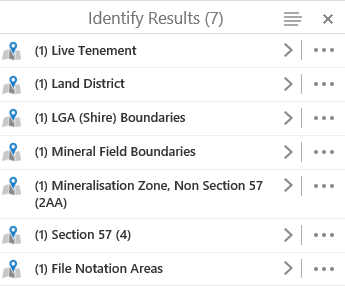
- The Tenement details are summarised in the Results panel.
- Expand the tenement results by clicking on the forward arrow icon.

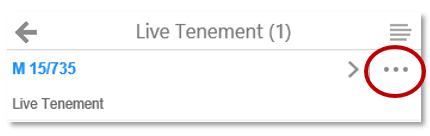
- Open the Feature Action Menu by clicking on the
 icon.
icon.
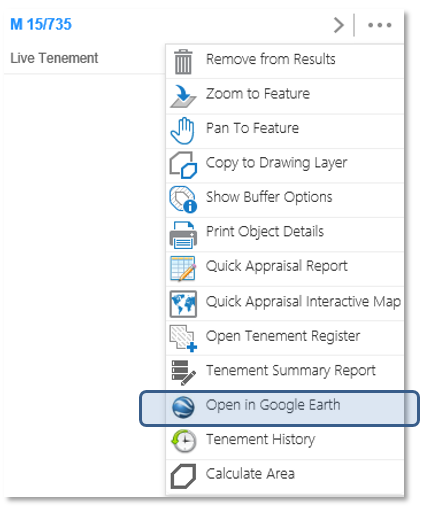
- Select the Open in Google Earth option from the menu.
- Confirm by clicking on the Open button.

- Google Earth will open and display the tenement selected from the TENGRAPH results panel.
NOTE: You must have Google Earth installed on your computer for this feature to work.
The Department's IT help desk cannot provide technical support in the installation or operation of Google Earth software.
Related: Overlay Aerial Imagery in TENGRAPH
Identify Aerial Imagery Currency (Capture date)
The currency of Landgate Aerial imagery varies though out Western Australia. Users need to check the date of the aerial imagery in their area of interest.
Within the Left Layers Panel locate the Base Maps folder and tick on the Landgate Aerial Imagery display check box.
Open the Context menu by Right mouse click (or Tap) the map display.
Select "Find data on the map."
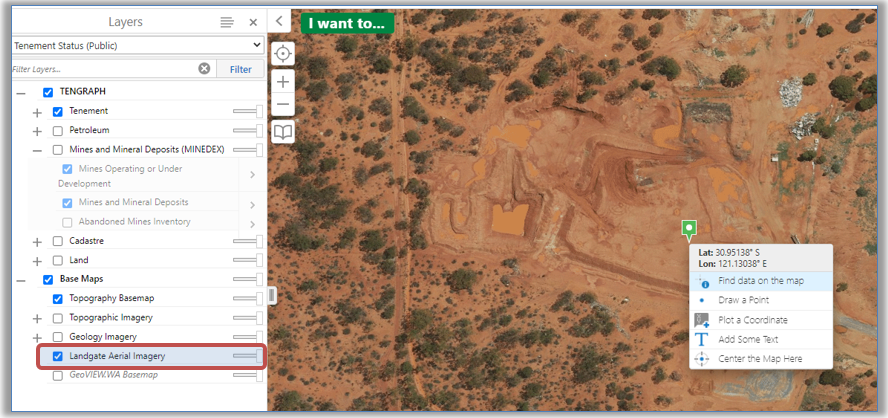
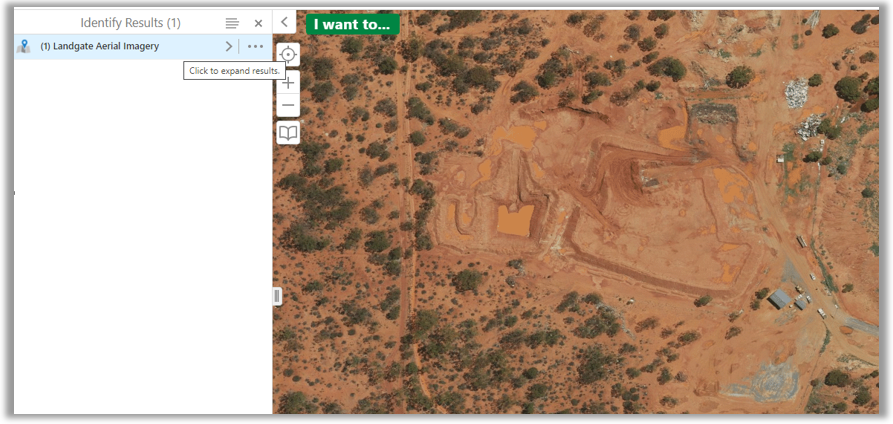
The Aerial Imagery Layer is identified in the Results.
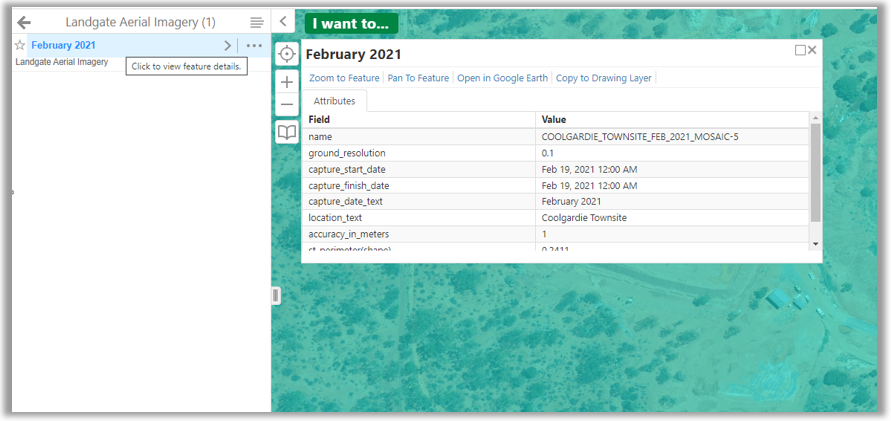
The aerial imagery capture date is displayed for this locality.
Left mouse click on the Results opens the Information on the data selected.
Selecting the Back Arrow will take you back to the Results identified by your last "Find data on the map" click.
Clicking on the Layers Tab located at the bottom of the Results panel will take you back to the Layers panel.
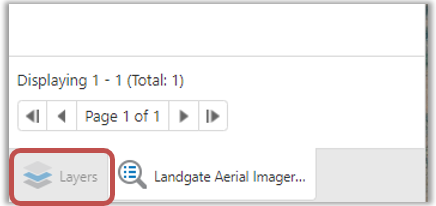
These tabs can be used to toggle between the Layers and Results panel.
TENGRAPH has recently been upgraded making it easier to identify and download Mineral Exploration Reports.
Identify a tenement on the map display.
From the 'Results' panel either open the:
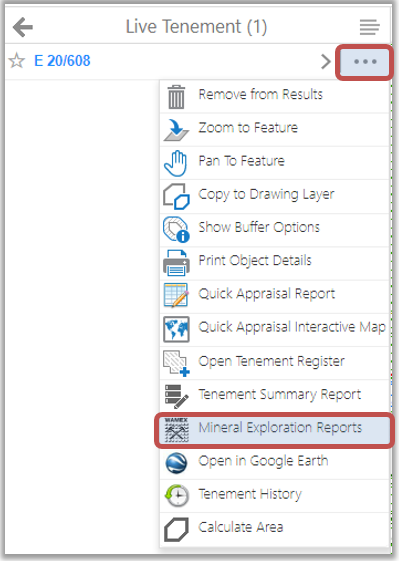
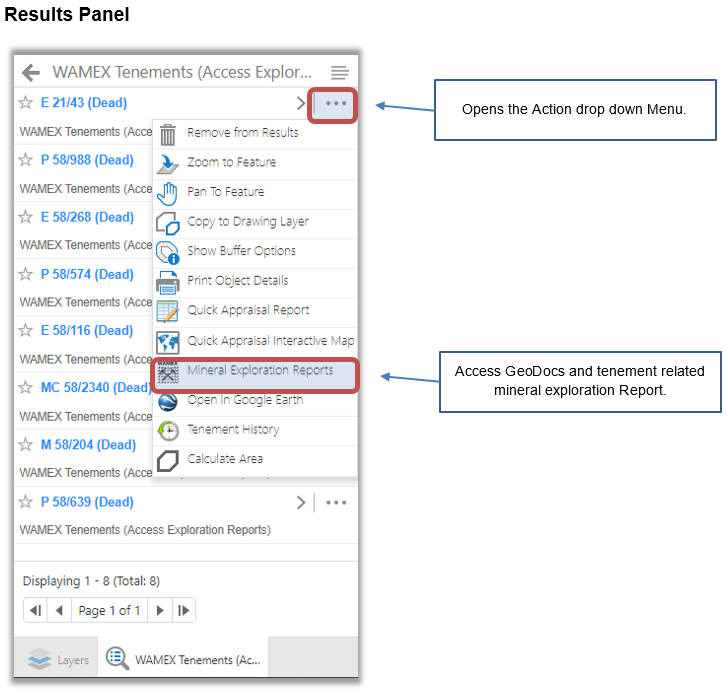
1. Tenement Action drop down menu by clicking on the three ... dots and then Mineral Exploration Reports.
Or
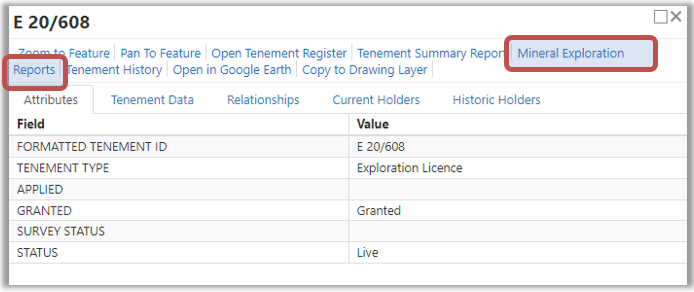
2. By clicking on the tenement ID shown in the Results and selecting Mineral Exploration Report from the information window presented.
The Results panel will refresh, listing all the reports related to the tenement selected.
Scroll through the results and click on the links as required.
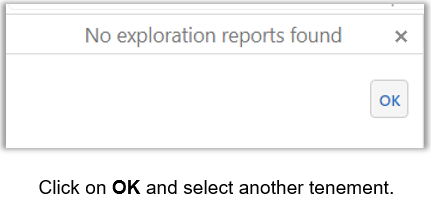
If an open exploration report does not exist for the tenement selected you will receive the following message:
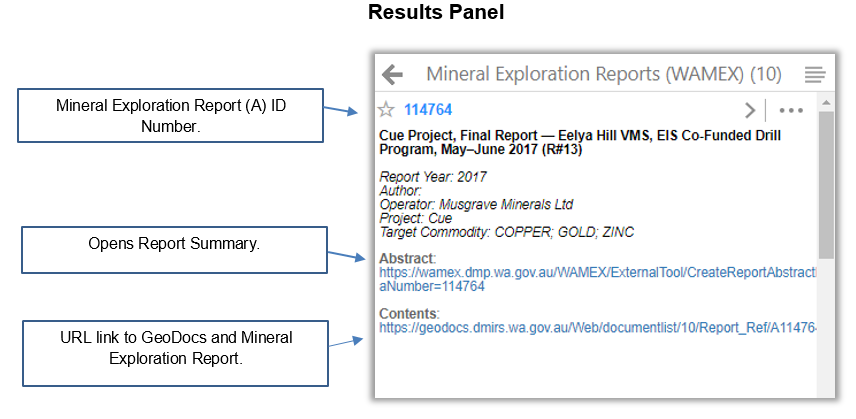
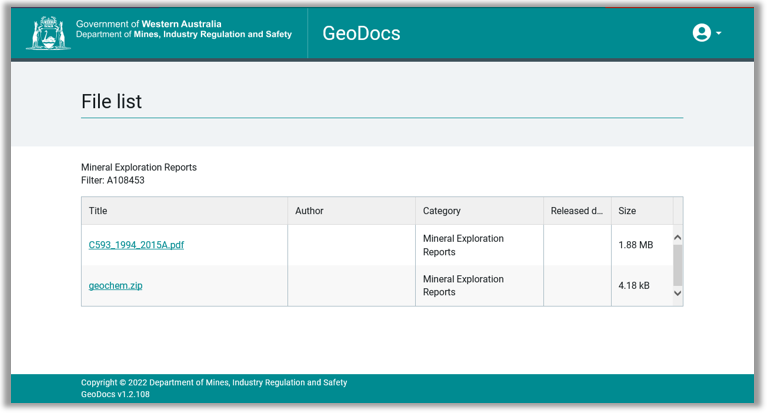
Clicking on the Contents: URL opens a new GeoDocs tab where you can download the report to your device.
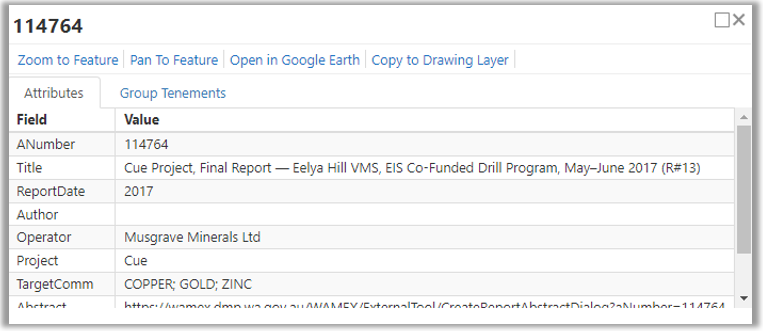
Clicking on the Report number shown in the Results panel opens the information window. The land affected by the report is highlighted blue on the map display.
Click here for information about annual mineral exploration reports lodged and stored in the Western Australian Mineral Database (WAMEX).
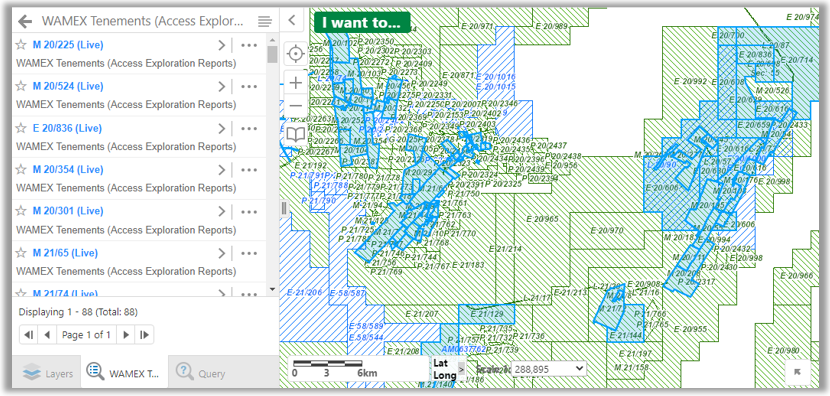
Approximately 2 in 3 live tenements and 1 in 3 dead tenements have mineral exploration reports. To visualise tenements with a related exploration report expand the Tenement Folder and turn on the WAMEX Tenements Map Layer shown below:
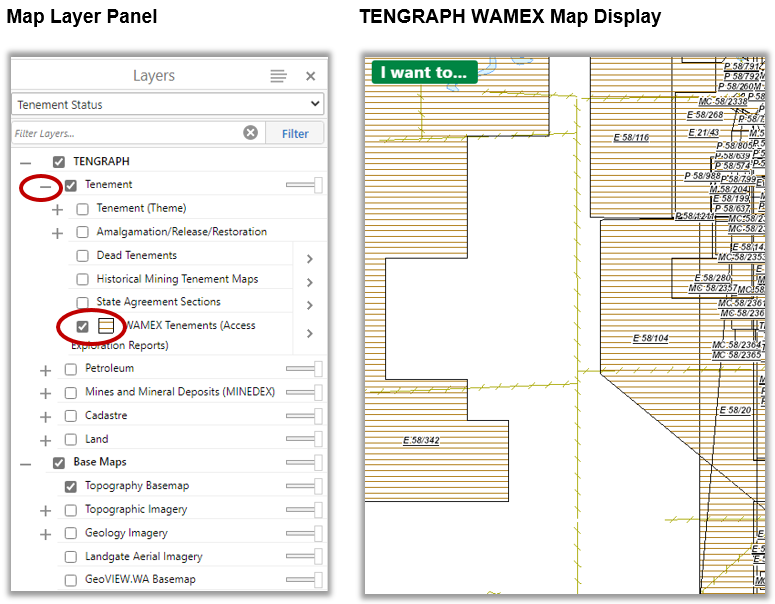
Tenement boundaries included within mineral exploration reports are displayed with a horizontal pattern between map scales 1:35 and 1:577,790.
Use of the map identify tools to list WAMEX tenements in the Results panel.
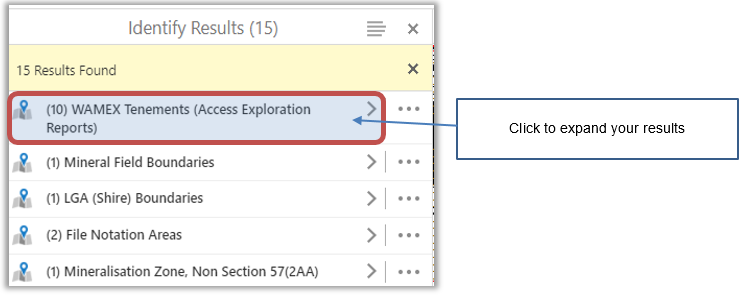
Select Mineral Exploration Reports from either Action menu or Information window as explained in the previous FAQ "How do I download Mineral Exploration Reports?"
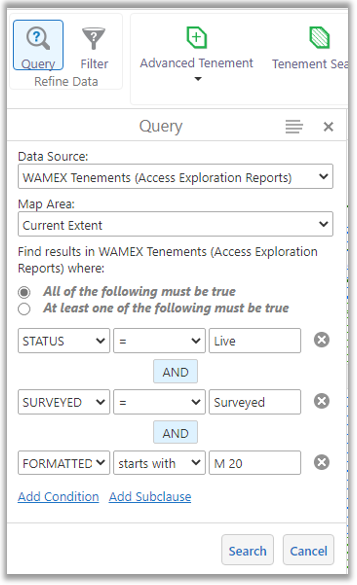
Hint: Whilst it is useful to be able to visualise the WAMEX tenements on the map as described above, an alternative and more flexible method of finding WAMEX tenements is to use the built-in Search Query tool as shown in the example below:

Here we have chosen live tenements, but we could for example, using "Add Condition", have further narrowed this to surveyed mining leases in the Murchison MF Cue District 20:
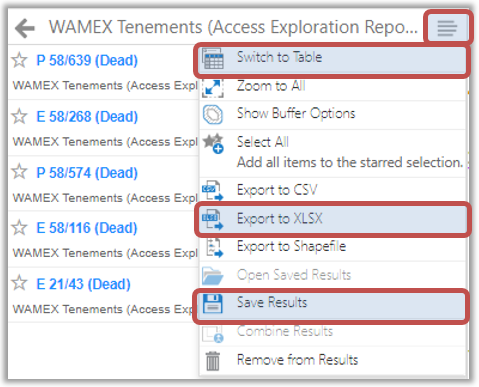
Tip: Select the 4 horizontal lines ![]() in the top right of the Results window, and switch to Table View.
in the top right of the Results window, and switch to Table View.
The Table View, you can sort the results by Date, Commodity or one of the other columns.
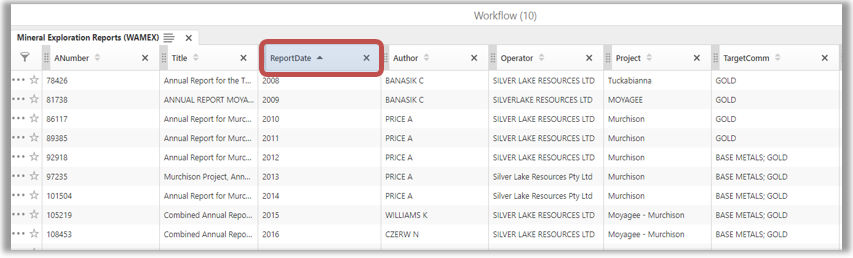
It is also possible to manipulate, save your results or export them as an Excel spreadsheet from the 4 horizontal line Action menu.
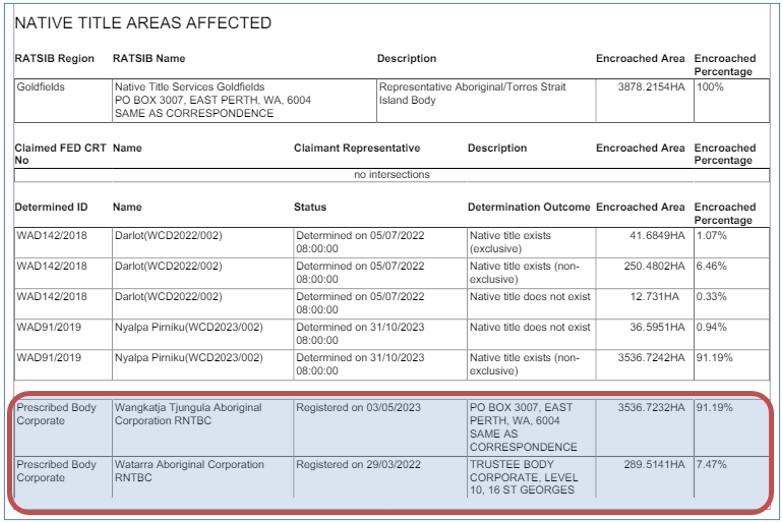
Native Title Prescribed Body Corporate (RNTBC) details are provided in the Quick Appraisal Report as shown below:
Quick Appraisal Reports are accessed from the I want to... menu or the Tenement result Feature Action Menu (depicted below).
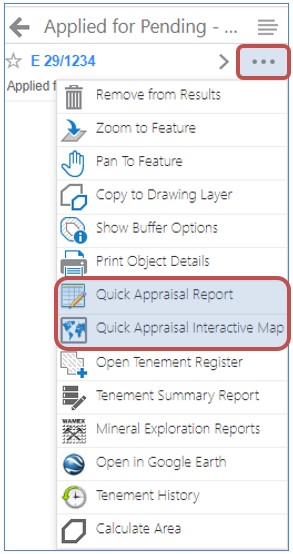
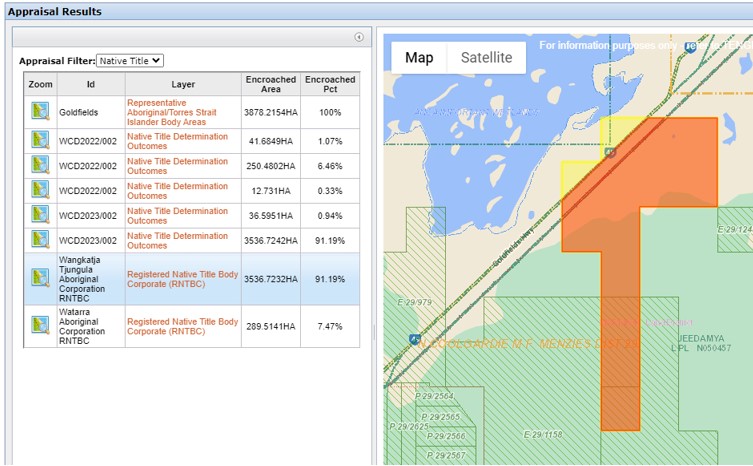
Use the Quick Appraisal Interactive Map option to visualise the land within the mining tenement represented by Registered Aboriginal Body Corporations (RNTBC).
TENGRAPH allows the import of shapefiles, these will populate into the Layers as a standalone layer which can be modified for purpose. The shapefile will also be identifiable and can have queries run against it such as the quick appraisal or buffer enquiry.
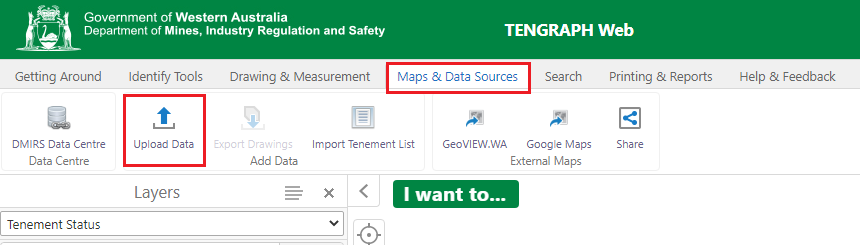
To upload a shapefile click on the 'Maps & Data Sources' menu tab, from there press the 'Upload Data' function in the 'Add Data' category.
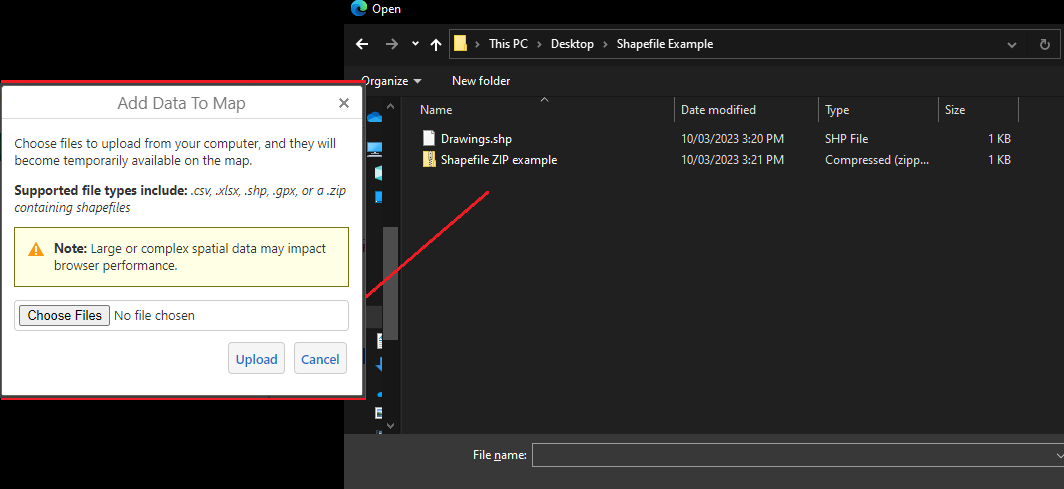
This will trigger a window with which the file/s can be uploaded. Navigate to the folder the files are located and select the files which contain the shapes. The upload data function can accept a variety of file types including .shp and .zip files as shown in the below example.
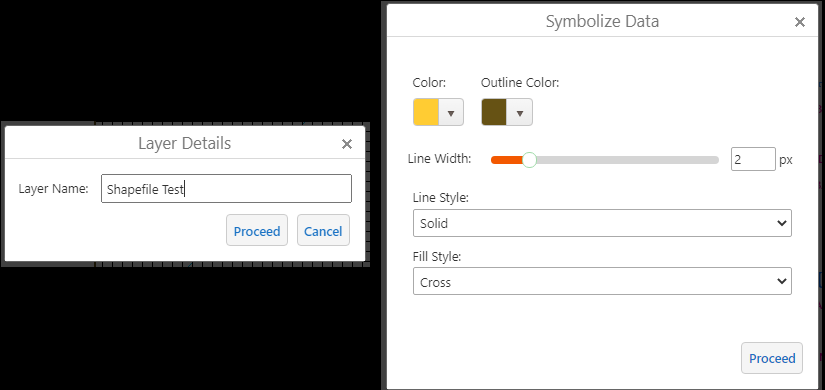
Once the files have been uploaded to TENGRAPH the next step is to name the layer and in the following step give it symbolisations.
Tip: change the fill style from 'solid' to allow better transparency
Once that has been confirmed the shape with the stylisations will appear on the map. It can be enabled, disabled and entirely removed.

The shape is also identifiable and can have the standard queries and manipulations performed against it.