TENGRAPH can display the results of a map query in two modes: a List view or a Table view.
1. Results List Views
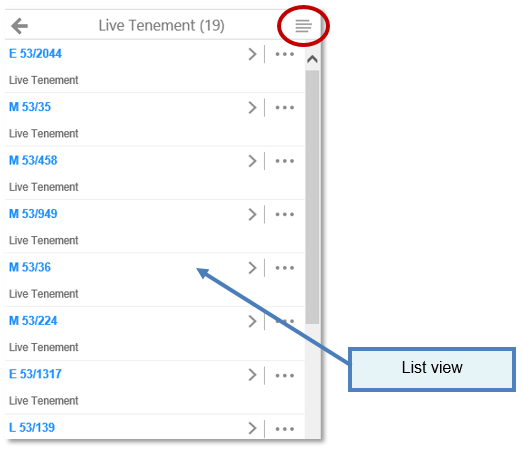
The Results List View displays the results in a list in the side panel.
To switch from a list to a table view...
- Open the Action menu (Click on the
 icon)
icon) - Select Switch to Table View.
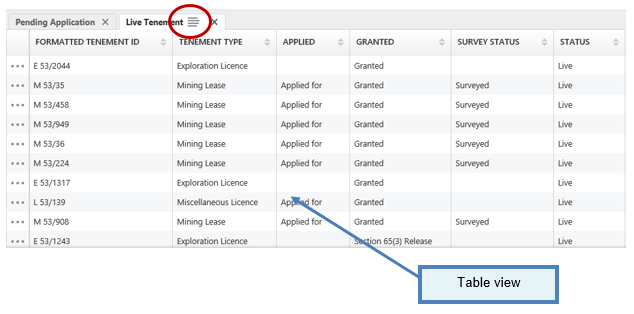
2. Table Results View
The table results show features in rows, with the attributes of each feature organized in labeled columns.
Switch from a Table view to a list view...
- Open the Action menu (Click on the icon)
- Select Switch to List View.
1. Export results to CSV, XSLX or shapefile formats.
- To save a set of results as a shapefile, CSV or XLSX file from a valid search or map selection open the
 summarized Action Menu.
 - From the menu select the format you want to save the results in.
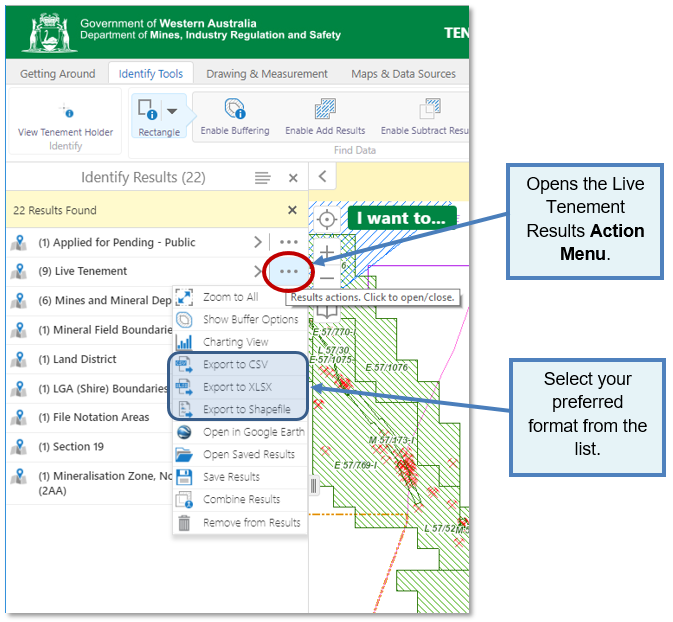
- The results are downloaded on your device in the chosen format.
Only DMIRS information can be exported. Cadastre or other data sets sourced from other agencies cannot be exported from TENGRAPH.
If you require digital extracts from another agency please refer to the Acknowledgements document for contact details.
State wide tenement and other DMIRS related data sets are available for download from https://dasc.dmp.wa.gov.au/dasc/
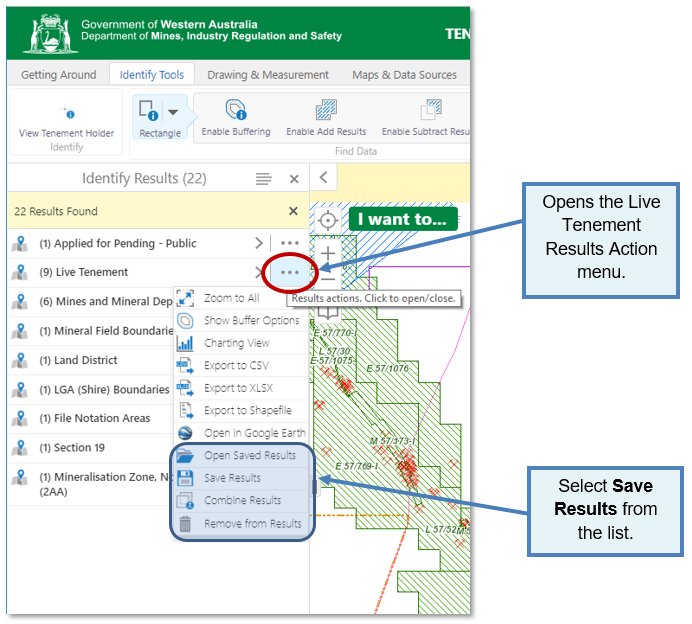
2. Save Results
- To save a set of results from a valid search or map selection open the Action Menu.
- Select Save the Results from the menu.
Saved Results only persist for the duration of your browser session. If you refresh or close the browser, you will lose all Saved Results.
To save results across sessions, save them within a project.
You can only open one set of saved results at a time. You can add or remove features either through the Actions Menu shown above, or via a link in a feature's map tip. You can also modify the current results by using the Combine Results option to either: add saved results, subtract saved results, or match intersecting saved results.
3. Starred Selections
There is also a built-in set of Saved Results called Starred Selection.
You can add or remove a result from the Starred Selection by clicking the star beside a result in the Results List or Results Table.
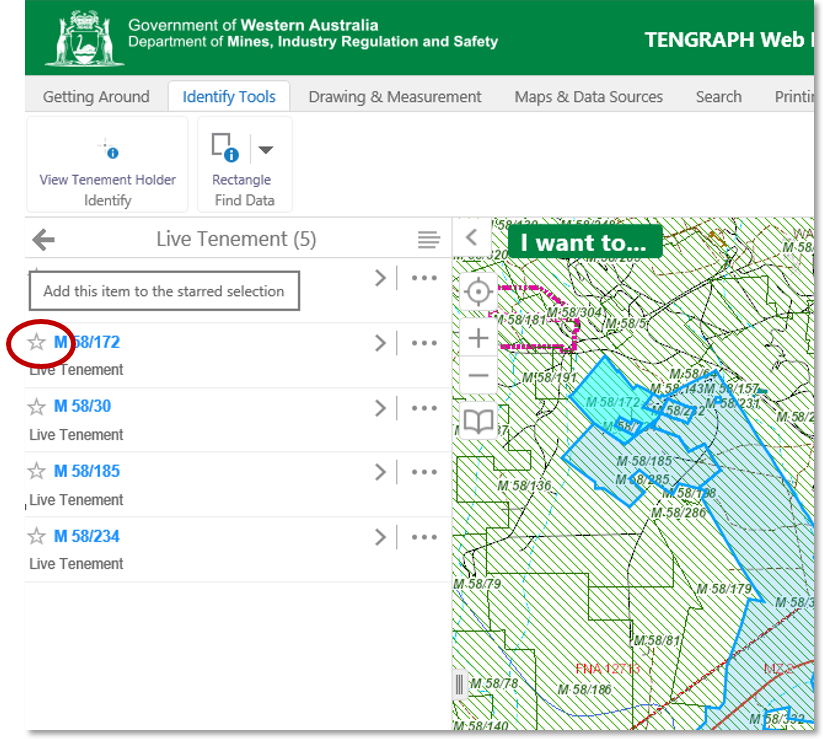
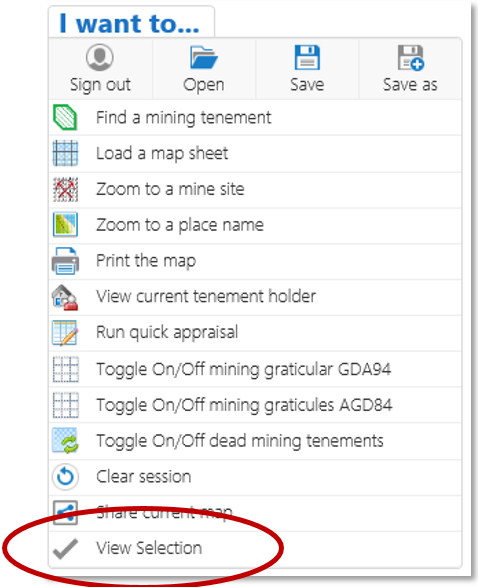
To view the Starred Selection at any time, click the I want to... menu and click View Selection.
The View Selection option only appears if you have added an item to the starred selection.
Tenement Holder Charts
For information on how to search or colour tenements by holder click here.
Another way to identify mining tenement holders is by creating pie chart.
This option displays holder information for tenements listed in the Results panel.
1. Turn off the Land Display by un-ticking the check box
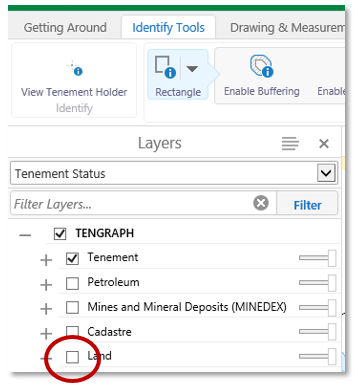
2. Open the Identify Tools Tab.
3. Open the Identify multi tool menu by clicking on the down arrow.
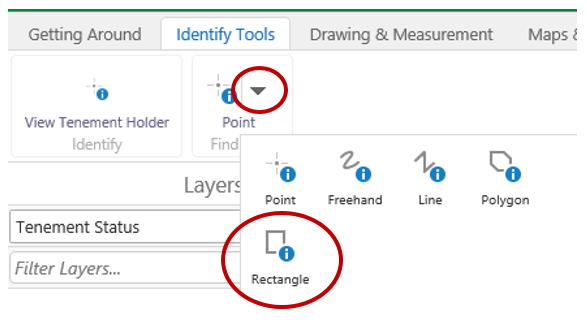
4. Click on the Identify Rectangle tool.
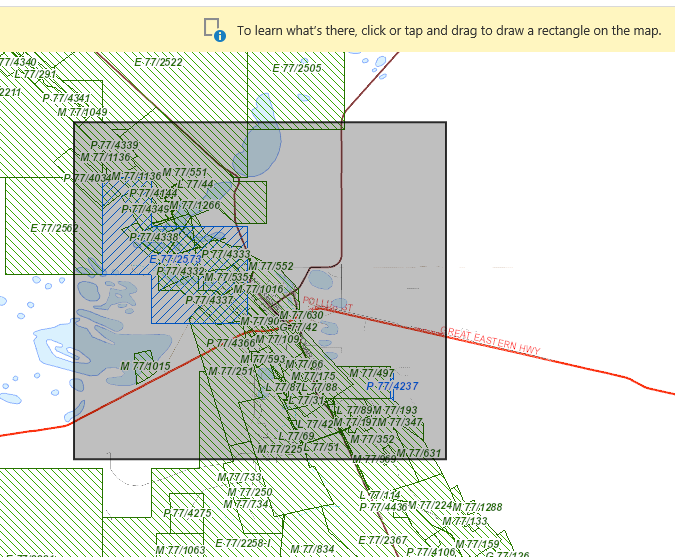
5. Identify tenements by drawing a rectangle on the map.
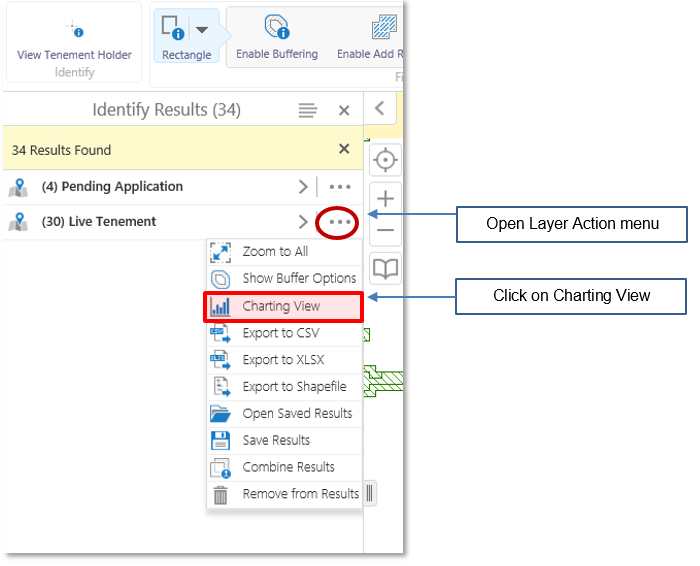
6. Within the Results, open the Live Tenement Action menu.
7. Select Charting View as shown below.
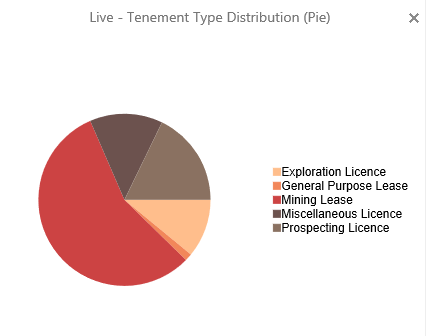
8. Tenement holders are portrayed in a pie chart. Hover your mouse over a pie chart slice for more information.
You will notice the pie chart and the map are linked. The map highlights the tenements in the same colour as the pie slice.
An example of a Live Tenement - Holder Pie Chart
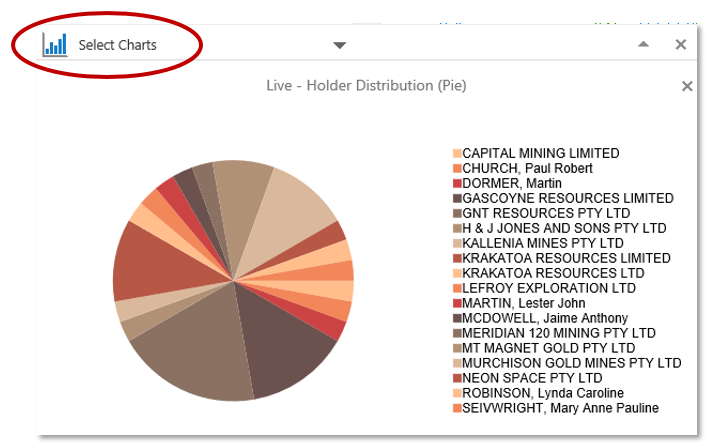
9. Open the Select Charts Menu. ![]()
10. Choose another chart from the list.
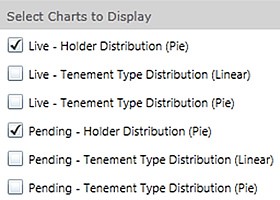
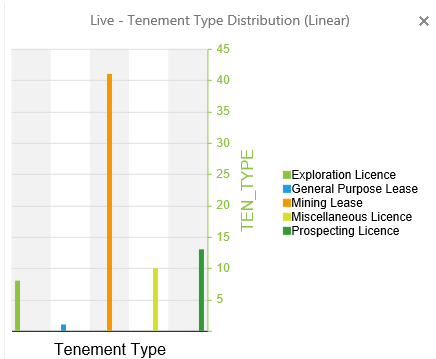
Further Chart options will be added in future software releases.