Mineral exploration relies heavily on the interpretation of increasingly varied and complex geoscience datasets. The Centre for Exploration Targeting (CET) at The University of Western Australia (UWA) and the Geological Survey of Western Australia (GSWA) have developed add-in tools for the ESRI ArcGIS platform. The Integrated Exploration Platform (IEP) uses innovative interactive visualization and image-analysis methods in two sets of visualization tools that are aimed at assisting the interpretation of different datasets, and improving interpretation confidence.
This development was financially supported by GSWA in the Exploration Incentive Scheme (EIS) and Australian Research Council (ARC) Linkage LP140100267. To register for the free version of IEP, to view sample tutorials, and for further information visit WA exploration platform.
The IEP was launched at the GSWA Open Day 2016 on 26 February 2016 and is freely available to Western Australia explorers on the IEP website.
Aim
Integrating a variety of exploration data into a single coherent interpretation is a challenging task which results in highly biased and inconsistent interpretations. The IEP aims to address this challenge by empowering mineral explorers operating in Western Australia with a state-of-art data analysis tool to maximize geological knowledge gained from GSWA data.
Functionality
Harnessing the power of computer visualization, image analysis, and an interactive and user-friendly interface, the IEP provides an interpreter-driven and computer-assisted interpretation workflow through two main functionalities:
1. Interactive multidata visualization tools to support the exploration and interrogation of multiple datasets simultaneously (2D and 3D)
2. Interpretation support tools for improving interpretation confidence through feature evidence assessment of interpreted features.
Interactive multidata visualization tools provide effective ways to interrogate multiple datasets to reveal similar or conflicting information; for example, checking coinciding magnetic and gravity anomalies at varying frequency scales.
These visualization tools use an interactive blending paradigm to improve the interpretation of complex information from multiple data sources. Blending combines datasets to form a single display in a way that effectively represents desired information from each dataset. Different multi-image blending tools are designed to support different types of data critical to mineral exploration, including 2D data such as geophysical data, radiometric data, and ASTER data, as well as blending visualization techniques for 3D volumetric data. Additionally, the IEP provides a data enhancement method that allows isolating features of a specific frequency range that is of interest.
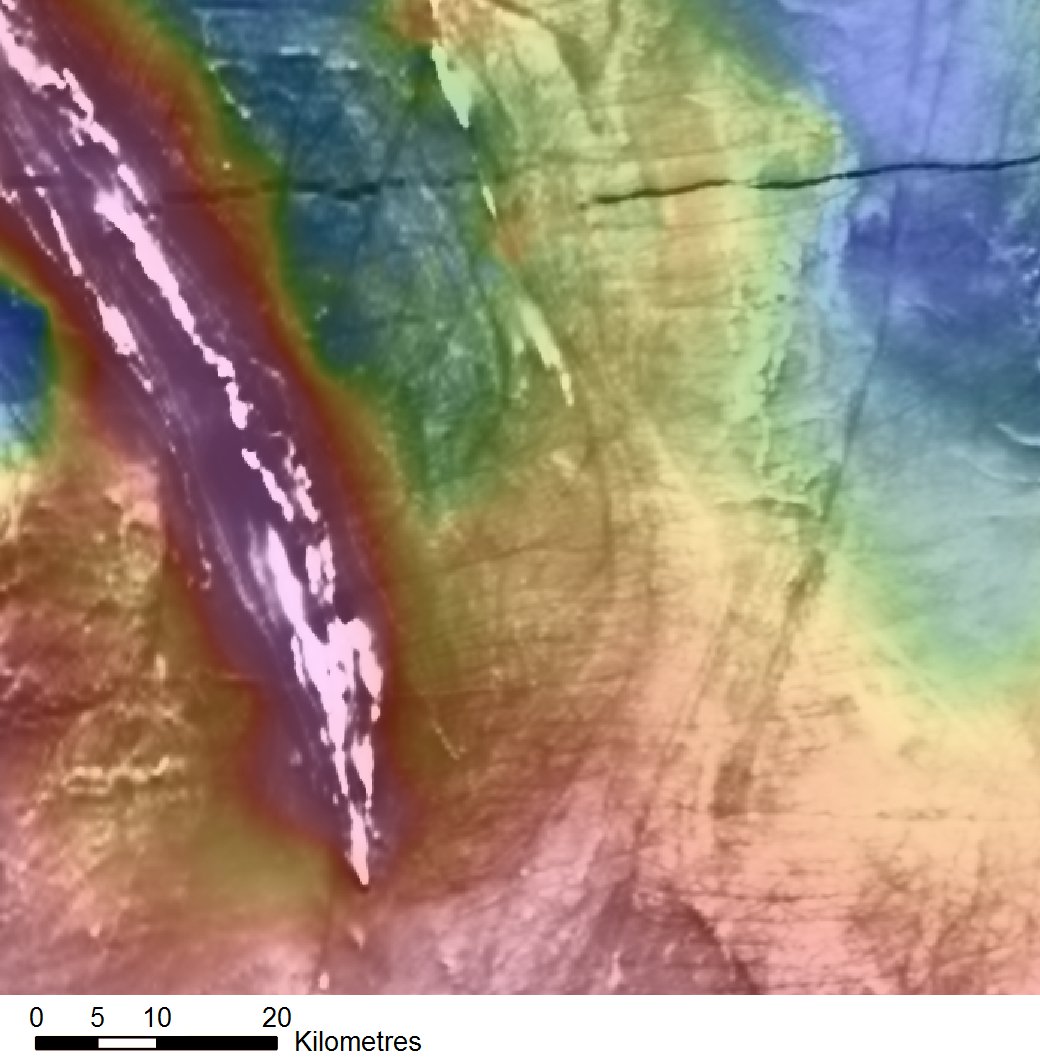
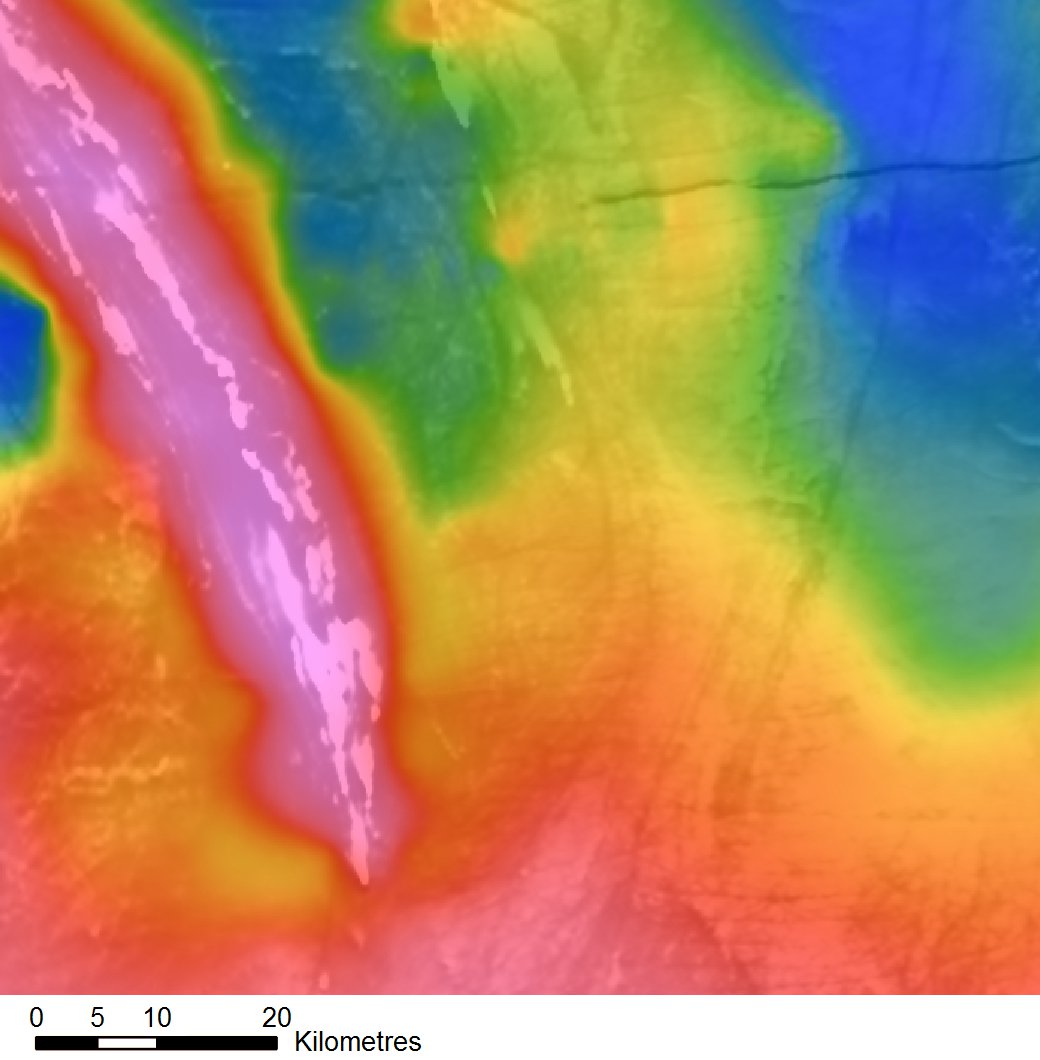
The figures below show an example of the blend output from one of the 2D blend tools in the Integrated Exploration Platform. Both images show different blend contributions of two datasets, where gravity data is shown with a rainbow colour scheme and aeromagnetic data is shown in greyscale.
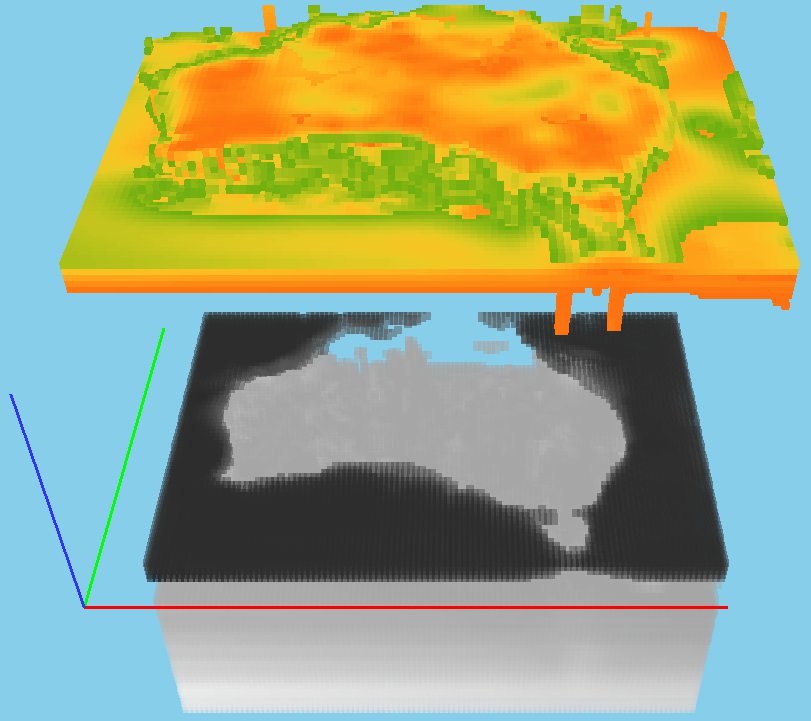
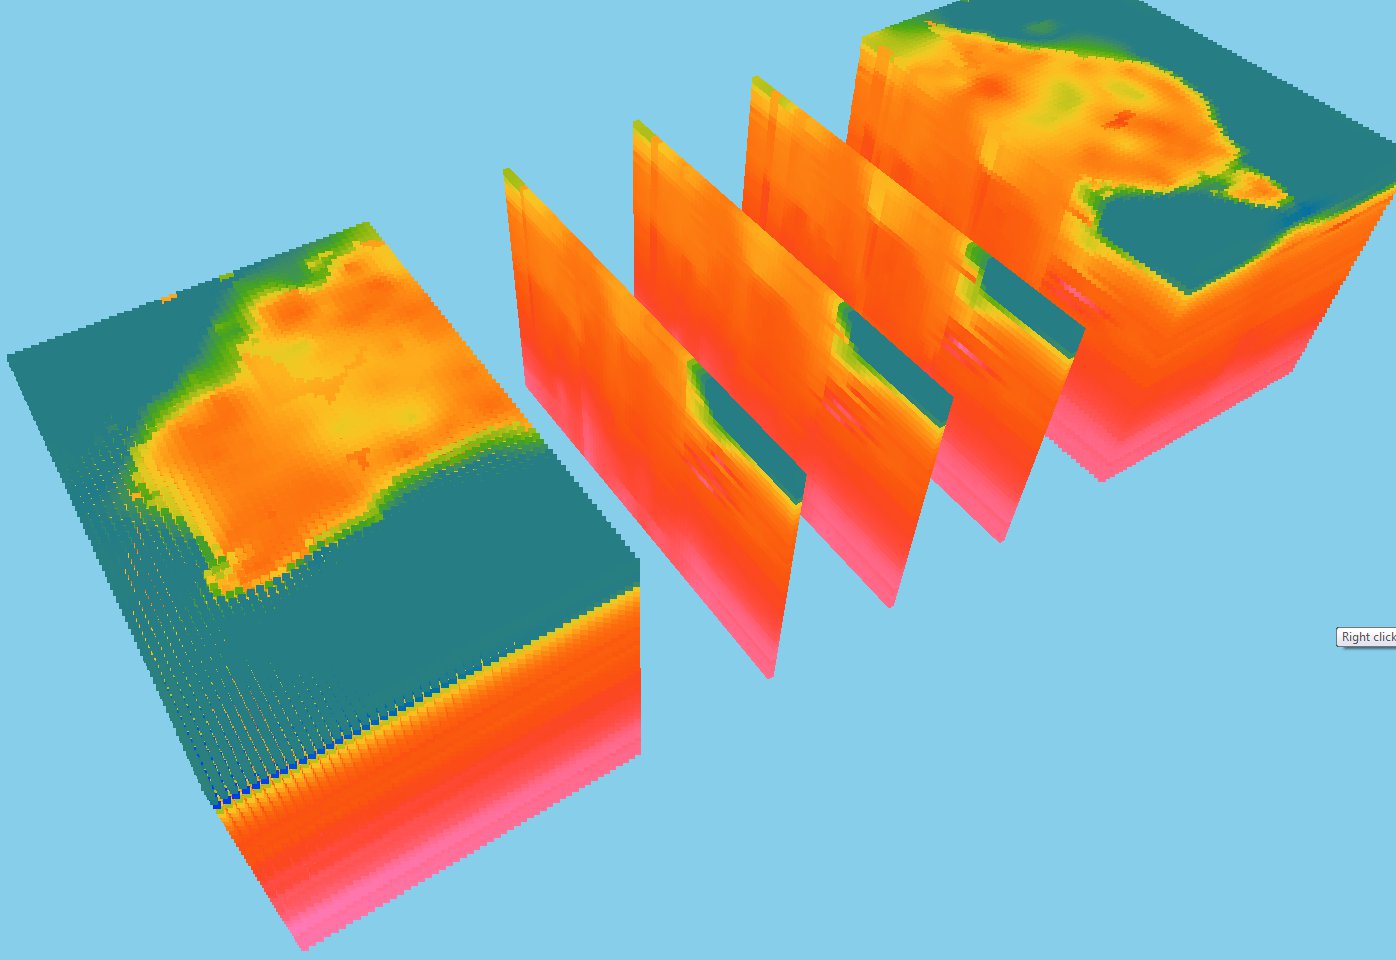
On the right are two examples of 3D visualization tools in the IEP:
(a) the Book Slice visualization mode: where three adjacent slice ‘windows’ of data are fixed in position, with interactive adjustments moving the dataset across these slice windows;
(b) the Threshold Offset visualization mode: an interactively selected range of values determines voxels with values falling within this range to be offset above the volume, and voxels outside this range remaining at greyscale, negative representation remaining below.
Note that both of these examples use the Australian Seismological Reference Model data.
Interpretation support tools use image analysis algorithms that provide quantitative feature evidence evaluation for structural interpretation of geophysical data. Using automated edge, ridge and valley feature detection algorithms, the IEP produces a number of feature-strength maps using a 2D geophysical dataset, such as magnetics, as input. The data overlay methods combine a feature-strength map with the original data through contributions to the hue (colour) and luminance (brightness) components respectively to provide the feature evidence on interpreted lines. There are two modes: an interactive spotlight visualization (left image below), and a buffered rectangle visualization along each interpretation line (right image below).
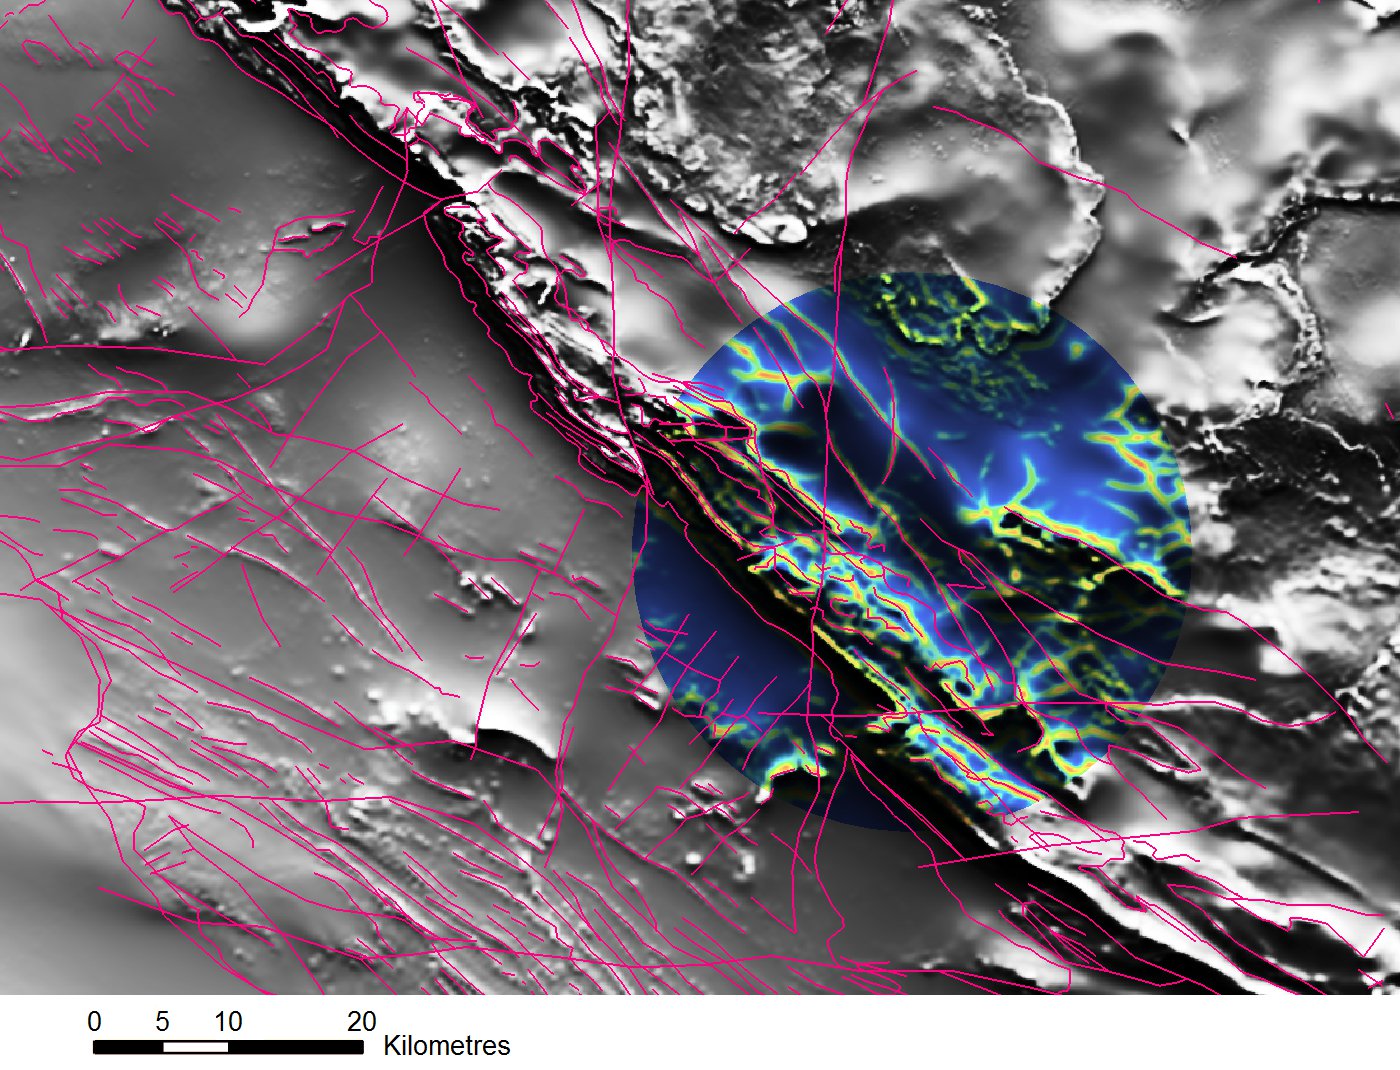
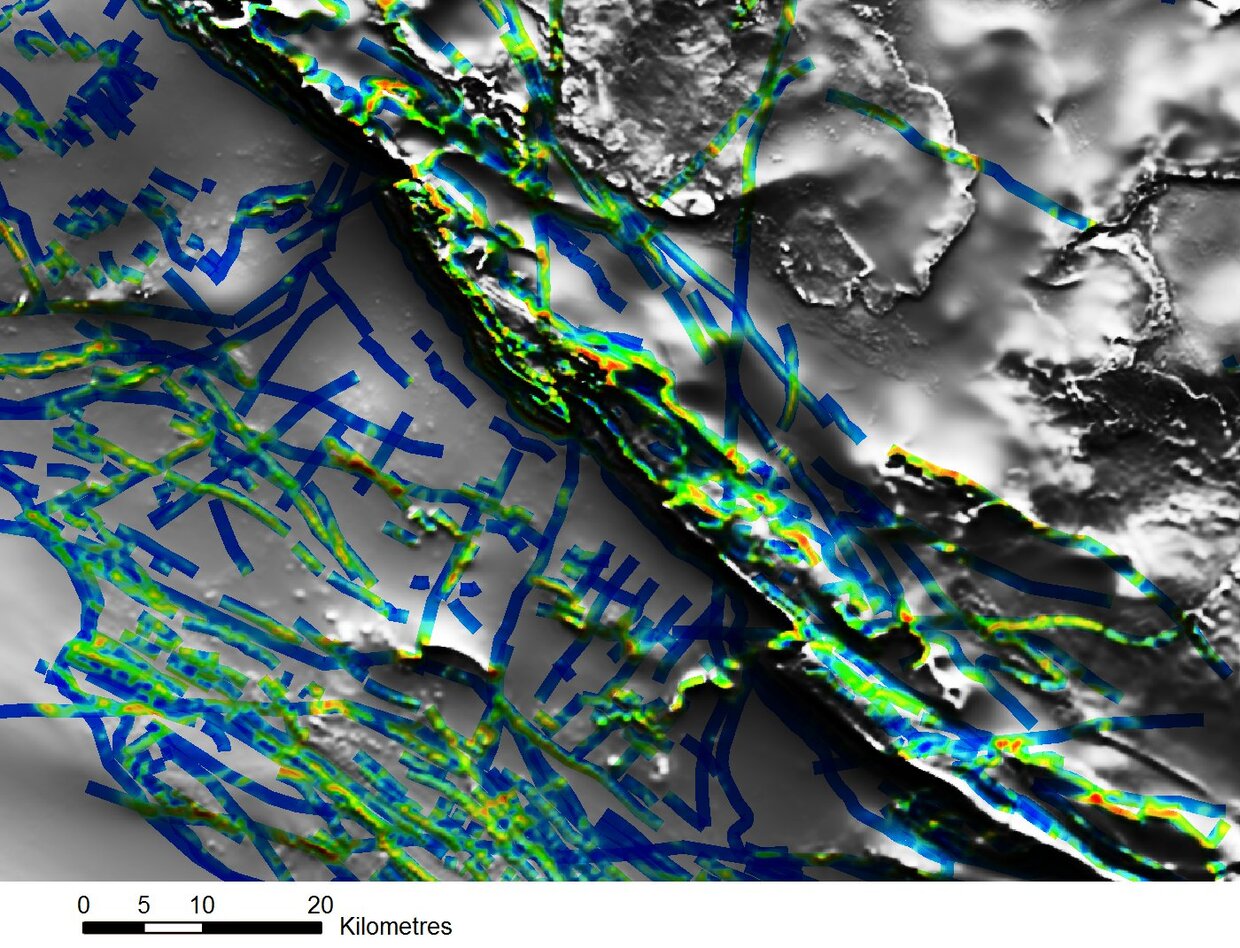
Visualization of feature evidence (in a rainbow map, cool colours indicating weak feature evidence, and warmer colours indicating strong feature evidence) together with the original magnetic data (in greyscale) and the interpretation lines: (left) the spotlight visualization mode: a circular spotlight region overlain with the ridge feature map is shown at the location of the mouse cursor and is updated in real time as the user moves the cursor; (right) the on-lines visualization mode: the edge feature evidence is shown along each of the interpretation lines, giving an overview of areas well supported by feature evidence.
Contact
For more information contact:
3Dgeoscience@dmirs.wa.gov.au