Subscribe to the Geological Survey of Western Australia (GSWA) eNewsletter to receive notices of planned and current geophysical survey programs and data release schedules.
To see locations and status updates of current proposed or in-progress surveys, filter on “Survey Status” in MAGIX or in the MAGIX Survey Blocks layers in GeoVIEW.WA.
Access to data
Data from regional airborne magnetic, radiometric and electromagnetic surveys, ground gravity surveys and deep seismic and magnetotelluric surveys in Western Australia that are funded by the State or Federal governments, are available from the locations listed below.
Survey source data are provided in the form of point-located (vector) datasets in industry-standard formats. Raster grids and georeferenced images are also available for most surveys.
GSWA also produces statewide compilation grids and images of magnetic, radiometric and gravity data from merged government and non-confidential company surveys (see MAGIX register of geophysical survey datasets). Compilation products are updated as new survey datasets become available.
Online data downloads are free of charge.
Media and handling charges apply for datasets requested on physical media via:
- GSWA Open-File Geophysical Data Request Form — $55 for a USB flash drive; $132 for an external hard drive
Survey source datasets
- MAGIX — GSWA Geophysical survey data repository (see the MAGIX web page for details)
- GeoVIEW.WA — Search under ‘Geophysical surveys’.
- National Geophysical Archive Data Delivery System (GADDS) — Regional magnetic, radiometric and gravity surveys
- Geoscience Australia Data Catalogue — Electromagnetic, seismic and magnetotelluric surveys
- AusPass — Passive seismic datasets
Statewide geophysical compilations
State compilation grids and images may be downloaded at no charge via the links below or from the GSWA Projects directory in the Pawsey Supercomputing Centre public data store.
These grids are not available to download from GADDS.
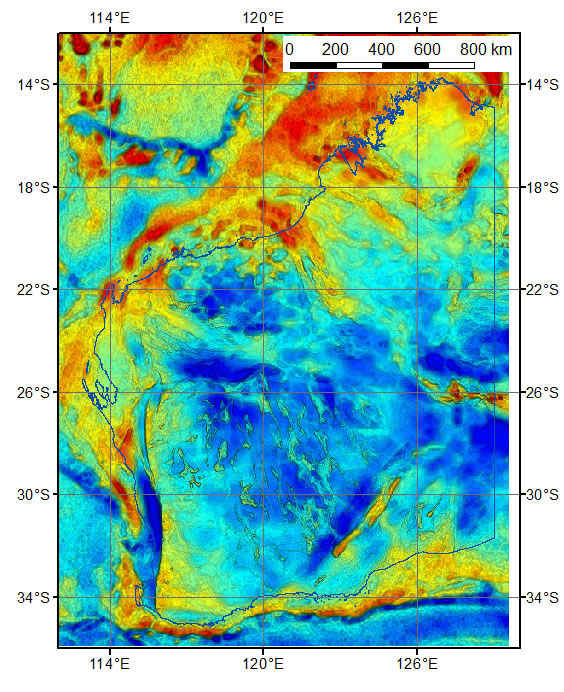
Magnetic anomaly grids of Western Australia (latest versions)
GSWA has generated magnetic anomaly grid compilations at 80, 40 and 20 metres in cell size by merging grids from Federal and State Government datasets, acquired with a line spacing of 500 metres or less, and from numerous open file company datasets at various line spacings. The Geoscience Australia magnetic grid of Australia is used as a base reference grid and also to fill in any background areas where closer spaced data is not available.
The latest grid data files in ER Mapper format may be downloaded via the links below or from the Pawsey Centre public data store. Image files for each grid are supplied in JP2 and KMZ formats. They are displayed in colour with relief shading, or greyscale. Refer to the relevant metadata sheet for further details.
Alternately, submit online order for all grids and images on an external drive (charges apply).
The recommended reference pattern for these grids is:
Brett, JW <year>, <20|40|80> m magnetic (TMI|RTP|1VD) merged grid of Western Australia. Geological Survey of Western Australia.
Download grids and other products — not all products are available for all cell sizes:
- Image files in JP2 and KMZ formats
- Total magnetic intensity (TMI) grid
- Reduced to pole (RTP) of TMI grid (80m and 40m)
- First vertical derivative (1VD) of TMI grid (80m and 40m)
- Multi-scale edges (worms) in vector formats (80m)
- Metadata for grids and images
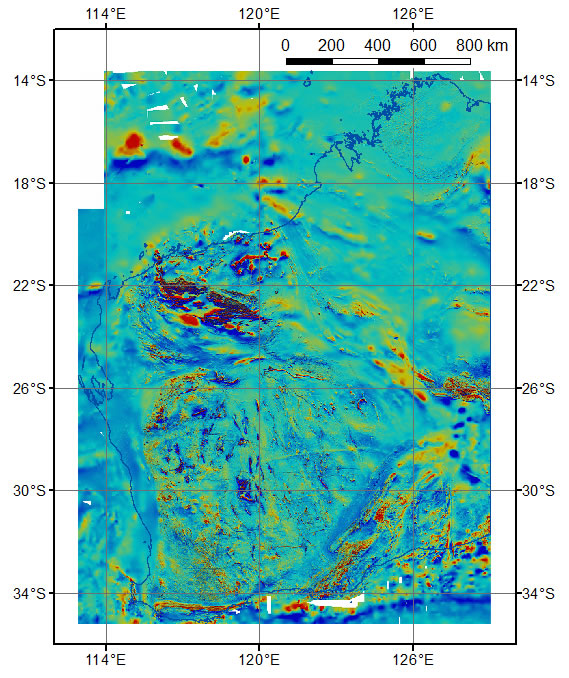
Radiometric grids (80 m) of Western Australia (latest version)
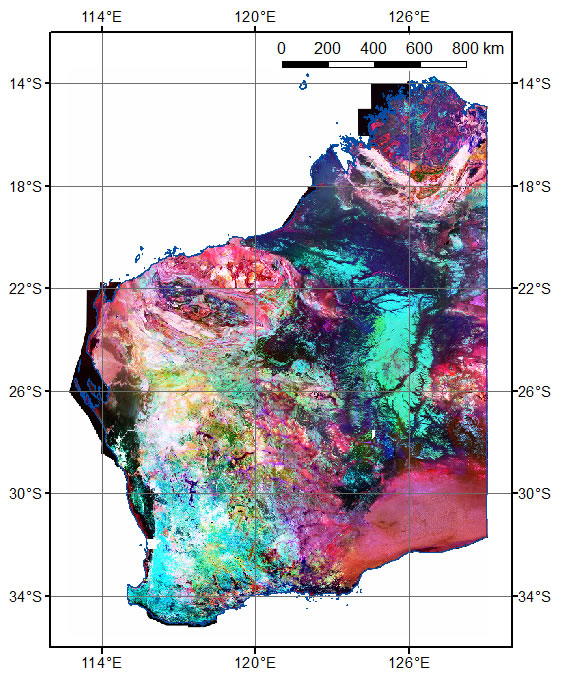
These four grid compilations at 80 metre cell size combine merged total count, potassium, uranium and thorium data (converted to radioelement concentrations) for onshore Western Australia. They are generated from Federal and State Government datasets, acquired with a line spacing of 500 metres or less and from numerous open-file company datasets at various line spacings. The 'Geoscience Australia radiometric map of Australia' is used to provide the base reference grids. All grids are in ER Mapper format with a cell size of approximately 80 metres (0.000833 degrees). Each grid file is approximately one gigabyte. The grid data files are also available from the Pawsey Centre public data store.
Pseudocolour images in JP2 format have been compiled for each grid. For the ternary radiometric image, potassium, thorium and uranium elements are displayed as red, green and blue. Refer to the relevant metadata sheet for further details.
The recommended reference pattern for these grids is:
Brett, JW <year>, 80 m radiometric merged grids of Western Australia. Geological Survey of Western Australia.
Download the grids and other radiometric products:
• Dose Rate (Total Count) grid
• eK_% grid
• eU_ppm grid
• eTh_ppm grid
• Individual grid images
• Ternary radiometric image in JP2 format
• Ternary radiometric image in KMZ format for Google Earth
• Metadata for grids and images
Submit online order for grids and images on an external drive (charges apply).
Gravity anomaly grid (400 m) of Western Australia (latest version)
The grid has a cell size of approximately 400 metres (0.004167 degrees). The Image file is supplied in JP2 format. It is displayed in colour (red high, blue low) with relief shading. Refer to the relevant metadata sheet for further details.
The recommended reference pattern for the grid is:
Brett, JW <year>, 400 m Bouguer gravity merged grid of Western Australia. Geological Survey of Western Australia.
Download the grid and other gravity products:
- Bouguer anomaly grid
- Image file in JP2 format
- Image file in KMZ format for Google Earth
- Multi-scale edges (worms) in vector formats
- Point Gravity Dataset of Western Australia in vector formats
- Metadata for grids and images
Submit online order for grids and images on an external drive (charges apply).
Australian National Gravity Grids (2019)
Australian National Gravity Grids for Free Air Anomaly, Complete Bouguer Anomaly and De-trended Global Isostatic Residual can be downloaded from the Geoscience Australia (ga.gov.au) Product catalogue. All the grids have a cell size of 400 metres.
https://ecat.ga.gov.au/geonetwork/srv/eng/catalog.search#/metadata/133023
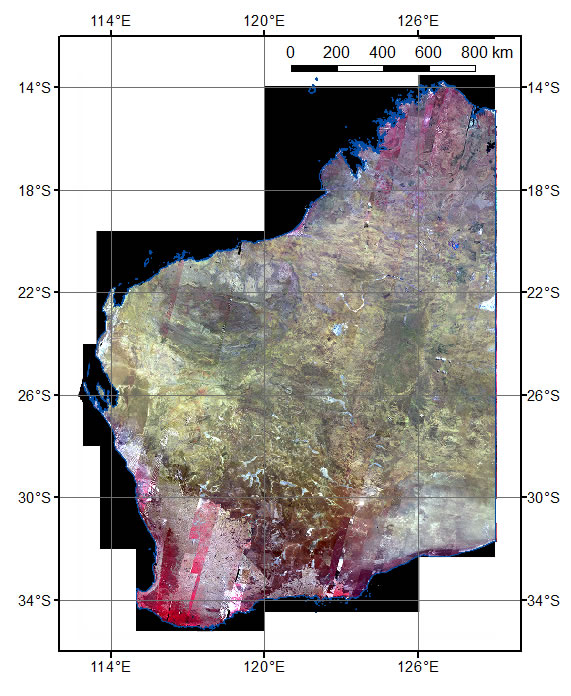
Satellite ASTER geoscience map of Western Australia
Date released: 15 November 2011
The Advanced Spaceborne Thermal Emission and Reflection Radiometer (ASTER) geoscience map of Western Australia is a set of public, digital geoscience products generated from satellite ASTER data. The project was a collaboration between the Department of Mines and Petroleum and the Centre for Three Dimensional Mineral Mapping Centre of Excellence (C3DMM) led by the CSIRO Minerals Down Under Flagship.
There are 17 ‘mineral group’ composition maps in the set, including 14 from ASTER’s nine visible, near-infrared (VNIR) and shortwave infrared (SWIR) ‘reflected’ bands, and three from ASTER’s five thermal infrared (TIR) bands. The products are available as geographic information system (GIS) compatible images (e.g. TIF and JPG format) or in image-processing software format (e.g. BSQ with headers). The State ASTER maps have been carved into 1:1 000 000 map sheet blocks with individual file sizes reduced to ~100 megabytes each.
Western Australia 1:250 000 map sheets geophysical images
The following geophysical images in JP2 format have been generated for individual 1:250 000-scale map sheets of Western Australia. The data for each sheet were extracted from the current State compilation grids and were histogram-stretched to match the data range in each sheet. Refer to the relevant metadata statement in each set for the data currency of the compilation grids from which these images were made.
- Bouguer Gravity images — colour
- Radiometric images of Potassium, Thorium, Uranium, Total Count - colour
- Ternary radiometric images of Potassium, Thorium, Uranium (KTU) — Red Green Blue composite
- Magnetic anomaly images
- Total magnetic intensity — colour
- Total magnetic intensity reduced to pole — colour
- First vertical derivative of total magnetic intensity reduced to pole — colour
- First vertical derivative of total magnetic intensity reduced to pole — grey scale
Goldfields area, Western Australia — 20 metre grid compilations
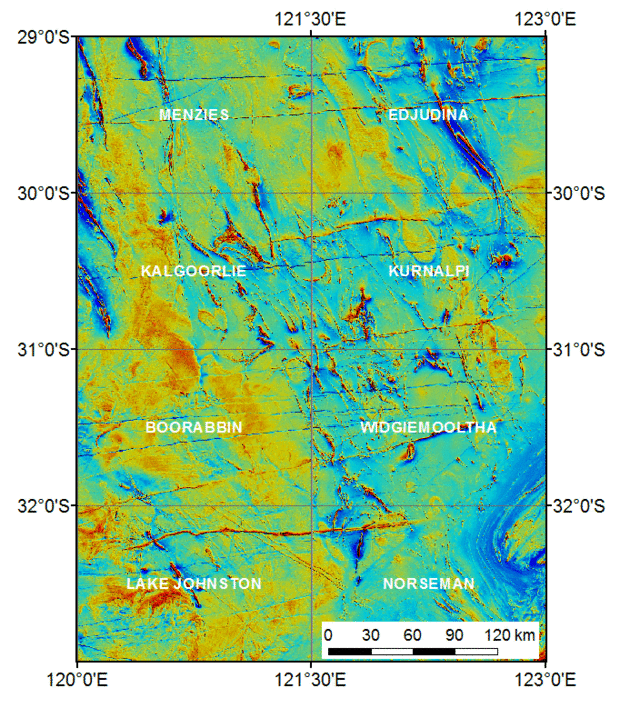
Date released: 12 September 2014
Compilation magnetic and radiometric grids and images covering the Goldfields area of Western Australia bounded by meridians 120E to 123E and parallels 29S to 33S.
The grid cell size is 0.000208 degrees (approximately 20 m).
The compilations include data from the following regional GSWA airborne surveys at 100 m line spacing: R70824 Menzies North 2013, R70824 Menzies South 2013, R70824 Kalgoorlie East 2013, R70824 Kurnalpi North 2013, R70824 Kurnalpi South 2014, R70824 Widgiemooltha North 2013 and R70824 Widgiemooltha South 2012.
Data from a number of open-file company surveys at line spacings of 100 m or less have also been included in the compilations.
Grids and images from the individual regional surveys are available via the GeoVIEW.WA application; located data from the National Geophysical Archive Data Delivery System (GADDS).
- TMI and radiometric grids in ER mapper format (ZIP, 4.8 GB)
- Images in JP2 and KMZ formats (ZIP, 100 MB)
GGMplus gravity acceleration data compilation over Western Australia

Date released: 11 October 2013
GGMplus (Global Gravity Model +) is a composite of GRACE and GOCE satellite gravity, EGM2008 and short-wavelength topographic gravity effects at 200 m resolution for all terrestrial and near-coastal areas of the Earth between ±60° latitude. For details see:
Hirt, C., S.J. Claessens, T. Fecher, M. Kuhn, R. Pail, M. Rexer (2013) New ultrahigh-resolution picture of Earth's gravity field, Geophysical Research Letters, Vol 40, doi: 10.1002/grl.50838
The paper and the data are available for download from the GGMplus website.
The GGMplus source data are distributed as a series of 5° x 5° tiles at a grid resolution of 0.002 degrees (7.2 arc-seconds). Geological Survey of Western Australia (GSWA) has compiled the ‘free fall gravity acceleration’ data from the 18 tiles that cover Western Australia into a single grid for the area bounded by parallels 12S–36S and meridians 112E–130E. By agreement with the authors, the compilation grid is made available here for download in ER Mapper and Geosoft grid formats. The gravity acceleration data are in units of µms-2 (gravity units).
Important: Short-wavelength features less than about 10 km in the GGMplus data are not derived from observations but were computed from 7.5 arc-second (~200 m) SRTM topography by assuming a constant density of 2 670 kgm-3 .
These short-wavelength features are NOT amenable to standard ‘mass difference’ interpretations.
- Global Gravity Model Plus compilation grid of gravity acceleration in ER mapper format (ZIP, 94 MB)
- Global Gravity Model Plus compilation grid of gravity acceleration in Geosoft format (ZIP, 90 MB)
- Image in JP2 format (ZIP, 3 MB)
- Windows® Program to convert Global Gravity Model Plus grids to ER Mapper format. Program provided on basis of ‘use at your own risk’. (Requires installation of Microsoft .NET Framework 4.5.) (ZIP, 300kb)
Contact
For more information contact:
geophysics@dmirs.wa.gov.au